
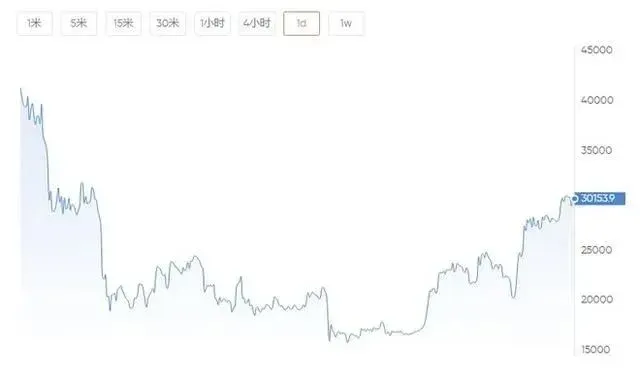
Bitcoin experienced a steep decline in 2022, but in 2023 it has begun to show signs of recovery, breaking the $30,000 level in April and suggesting a possible rebound from the abyss.

Last year, market observers were forced to recalibrate their expectations. Early forecasts had predicted that Bitcoin would reach $100,000, a target that now appears overly optimistic, and most analysts have lowered their short‑term price estimates. Recent price action, however, is showing warming trends.
On November 9, 2022, after the collapse of the FTX (FTT) exchange, BTC fell to a low of $15,682.69, rebounded the next day to $18,054.31, and then slipped again to around $16,850, still far below the all‑time high of $68,789.63 set in November 2021. In early December the price briefly broke $17,000, only to fall back below that level on December 12. The following sections outline the main factors that have driven Bitcoin price fluctuations and provide an overview of the latest forecasts as of April 18, 2022.
In this article we compile the key drivers of Bitcoin since its major correction last year, assessing how macro‑economic conditions, on‑chain metrics, and regulatory developments influence its recovery path. By deeply analysing data and case studies, we aim to help readers clarify the current market logic and gauge possible future directions. Please continue reading.
How Does Bitcoin Work?
Bitcoin is a decentralized digital currency proposed by the pseudonymous developer Satoshi Nakamoto in 2008 and launched on the blockchain with the creation of the genesis block in January 2009. Its core operating mechanisms include:
- Proof‑of‑Work (PoW): Miners use computational power to solve block hash puzzles; successful miners receive transaction fees and newly minted Bitcoin as a reward.
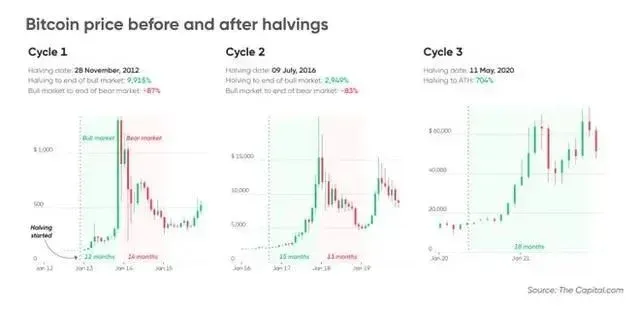
- Supply cap: The total supply is fixed at 21 million coins, with the block reward halving every 210,000 blocks. The most recent halving occurred on May 11, 2020, reducing the block reward to 6.25 BTC; the next halving is scheduled for 2024.
- Circulation: As of December 12, 2022, roughly 19.2 million Bitcoins were in circulation, with the final coin expected to be mined around 2140.
Historical Bitcoin Prices
The table below lists price ranges before and after major halving events, helping to illustrate historical volatility patterns:
| Halving Year | Avg. Price 1 Year Prior | Avg. Price Halving Month | Highest Price Next Year |
|---|---|---|---|
| 2012 | ≈ $12 | ≈ $12 | > $1,000 |
| 2016 | ≈ $650 | ≈ $650 | $20,000 (2017) |
| 2020 | ≈ $9,000 | ≈ $9,000 | $68,789 (2021) |
Bitcoin is often described as “digital gold” because of its scarcity, and retail investors use it to diversify risk and hedge against declines in traditional assets such as stocks and bonds. However, as institutional capital has entered the market, its correlation with equities has gradually increased.
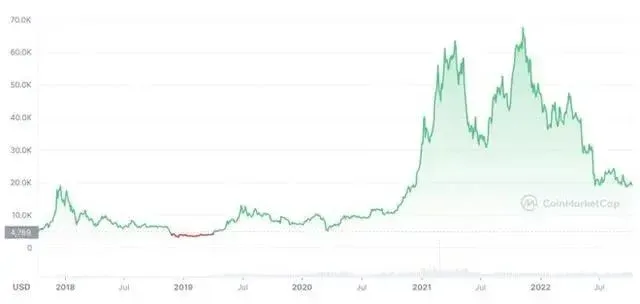
- 2017: The price surged from roughly $1,000 at the start of the year to a mid‑December peak of $20,000.
- 2018: A sharp sell‑off pushed the price down to $8,000 within a month, and it fell below $4,000 by year‑end.
- July 2019: Bitcoin reached a high of $13,129.53.
- May 2020 halving: The year closed at $29,000, followed by continued upward momentum in 2021.
In mid‑April 2021, Bitcoin broke $64,000, then slipped to $29,360.96 in July, before hitting a new all‑time high in November. After entering 2022, the market entered a bear phase and prices kept declining.
2022 Bitcoin Performance Review
Throughout 2022, Bitcoin experienced multiple sharp swings, driven primarily by the events listed below:
- January: On January 24 the price fell to $33,184.06; on February 10 it briefly rebounded to $45,661.17, then retreated to $34,459.22 amid the Russia‑Ukraine conflict.
- March: On March 28 the price peaked at $48,086.84, but could not hold the level.
- May: On May 12 the price dropped to $26,350.49 as the U.S. Dollar Index reached a 20‑year high and the Terra collapse triggered capital outflows.
- June: After a short‑lived breach of $31,000, the price fell to $17,708.62 on June 18; it then bounced three times above $20,000, reaching $24,196.82 on July 20.
- July: Several crypto firms filed for bankruptcy or restructuring (e.g., Three Arrows Capital, Voyager Digital, Celsius Network, Zipmex, Vauld), undermining market confidence.
- Tesla: On July 21, Tesla sold approximately $936 million worth of Bitcoin due to uncertainty surrounding China’s COVID‑19 lockdowns, pushing the price below $23,000.
- October‑December: On October 11 the market cap was about $366 billion with the price near $19,000; on November 5 it recovered to $21,446.89; subsequently, the FTX bankruptcy drove the price down to a low of roughly $15,834, with a brief rebound to $17,378.15 on December 5. The year closed at $16,547.50, a decline of more than 60 % year‑over‑year, while the S&P 500 fell only about 20 %.
Early 2023 Recovery Signals
Entering 2023, Bitcoin displayed several bounce‑backs:
- Mid‑January: The price broke the $20,000 barrier.
- February 16: It reached a high of $25,134.12.
- March: The collapse of Silvergate Bank caused a dip to $19,628.25 on March 10.
- April: On April 11 Bitcoin first crossed $30,000, and on April 14 it peaked at $31,005.61 before slipping to around $29,900 on April 18, with a market cap of roughly $578 billion.
Conclusion
Considering the deep correction of 2022 and the price rebound observed in 2023, Bitcoin appears to be gradually emerging from the abyss. Nevertheless, its trajectory remains subject to macro‑economic conditions, regulatory policies, and internal industry risks, so participants should remain prudent.
This concludes the detailed analysis of “Can Bitcoin (BTC) continue its recovery from the 2022 abyss?” For further forecasts on Bitcoin prices in 2023, please refer to other articles on Bitaigen (比特根).
Related Reading
- Bitcoin Price 2023 Forecast: Challenges from USD Strength & Regulation
- Bitcoin Near $100K Before US Election Says Standard Chartered
- Bitcoin Hedging Guide: Cash-Futures Arbitrage & Risk Protection
💡 Register on Binance with referral code B2345 for the maximum trading fee discount. See Binance complete guide.


