
Starting from the inflation mechanisms, we systematically compare the issuance models of Bitcoin, Ethereum and Solana, explain the underlying economic logic and long‑term supply trends. Through charts and case studies, readers can clarify the inflation differences across consensus layers, assess asset scarcity and potential risks, and look forward to more detailed analysis in subsequent sections.
Bitcoin, Ethereum, Solana Inflation Differences
Bitcoin uses Proof‑of‑Work with scheduled halvings, so its inflation rate falls as block rewards decline; Ethereum employs Proof‑of‑Stake, where issuance is affected by staking and fee burning, resulting in a near‑zero net inflation; Solana follows a fixed inflation schedule of roughly 5.1 % per year, gradually decreasing.
1. Bitcoin: Fixed issuance schedule via Proof‑of‑Work (PoW)
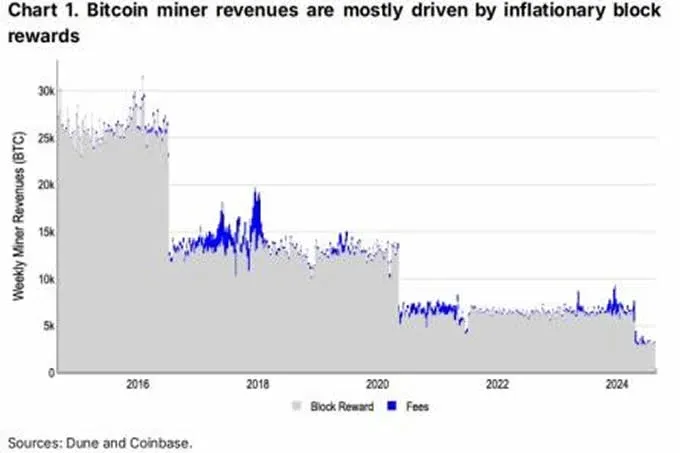
Bitcoin creates roughly one block every 10 minutes; miners receive the newly minted block reward, which is added to the circulating supply. Every 210 000 blocks (about four years) the reward is halved—starting at 50 BTC in the genesis block, currently 3.125 BTC, and will continue to decline. Until the supply cap is reached, Bitcoin remains an inflationary asset, with the current reward schedule producing about 164 k BTC per year.
In addition to the block reward, miners also collect transaction fees (effectively “tips”). These fees are taken from existing supply and do not create new coins. As the block reward shrinks, fees are expected to become miners’ primary revenue source.
Bitcoin mining is expensive; miners often need to sell a portion of their BTC to cover upfront financing, electricity, taxes, and labor costs. Even as block rewards fall, the network’s total hash rate keeps rising, compressing the profit margin per unit of hash power.
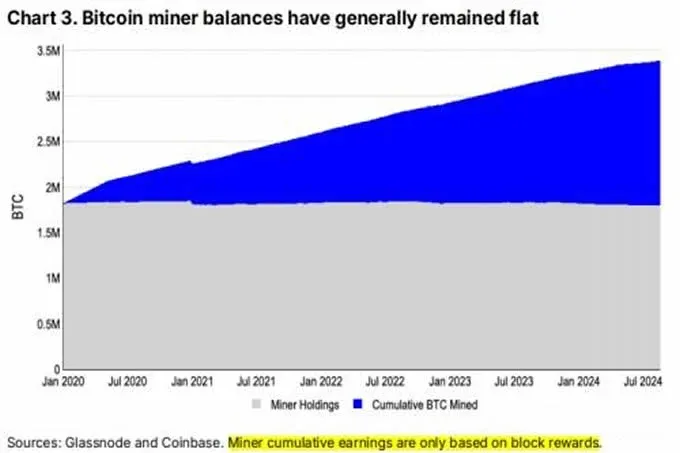
The chart below shows that after the May 2024 halving, hash‑rate growth stalled, indicating that miner profits are approaching their limit—given the BTC price and hardware costs at that time, expanding capacity no longer yields profit. The light‑gray area represents BTC held by miners, while the blue line tracks the cumulative issuance of block rewards since January 2020. From mid‑2022 onward, miners’ BTC holdings have been declining, suggesting that in the past two years the rate at which miners sold BTC may have exceeded the rate at which they mined it, i.e., miners are still off‑loading previously earned coins.
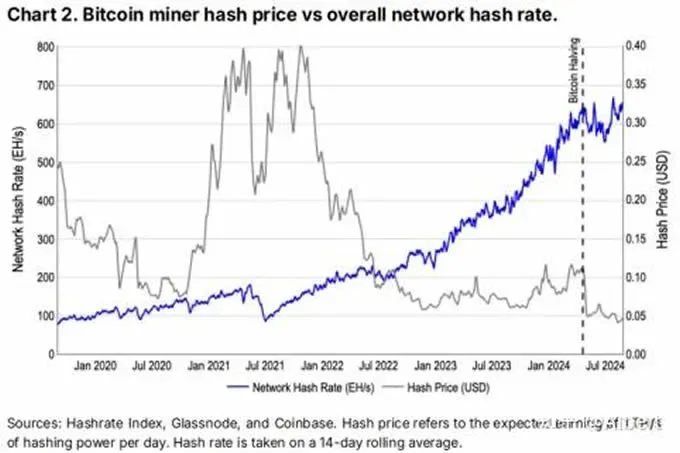
Since the May 2024 halving, miners’ potential earnings (i.e., potential sell pressure) have averaged about US $218 million per week. This outflow has been largely offset by inflows into U.S. Bitcoin spot ETFs, which are denominated in USD and typically accessed via SEPA/SWIFT for fiat conversions. However, ETF inflows are also slowing: between mid‑July and mid‑August 2024, ETF holdings rose by roughly 17 k BTC, while miner earnings amounted to about 15 k BTC. The analysis indicates that Bitcoin’s inflation rate—reflected by total miner income—is a significant source of market‑wide sell pressure.
Note: Crypto gains, including those from mining or staking, may be taxable in your jurisdiction. Consult a tax professional for guidance.
2. Ethereum: Dynamic issuance via Proof‑of‑Stake (PoS)
Ethereum’s inflation rate is often compared with Bitcoin’s, yet its impact on capital flows works differently. After the 2022 transition from PoW to PoS, network energy consumption dropped by roughly 99.98 %, virtually eliminating operational costs; consequently, stakers can retain a larger share of block rewards and tend to adopt longer‑term holding strategies.
Under PoS, issuance is linked to the total value staked, following the formula:
Maximum annual issuance = 941 × √(number of validators).
Currently there are about 1.06 million validators, resulting in roughly 18.6 k ETH newly issued each week. At the same time, the base fee component of every transaction fee is burned completely after the London hard fork (EIP‑1559), while the priority fee is awarded to validators. This burn mechanism is key to understanding Ethereum’s inflation: during periods of high transaction fees (e.g., Q2 2023 and Q1 2024), the amount burned exceeded the amount issued, pushing ETH into a net‑deflationary state.
Since the Merge in 2021, ETH has generally trended toward net deflation, with the burn rate surpassing the issuance rate. Between September 2022 and August 2024, total supply fell by about 220 k ETH. Nevertheless, Ethereum has experienced several inflationary phases; recent inflation appears relatively “sticky,” closely tied to the network’s scaling roadmap. The latest data show an annualized net inflation rate of roughly 0.7 %, equivalent to about 17 k ETH per week.
Even when “inflation” occurs, its direct translation into sell pressure is not obvious. Staking remains the primary absorber of ETH supply, consuming far more than the amount issued or burned. The chart below shows that since January 2023, cumulative issuance accounts for only 7.7 % of the growth in staked ETH. Therefore, assessing ETH’s sell pressure solely by its inflation rate can be misleading.
*For U.S. residents, access to non‑U.S. platforms such as the global Binance is restricted; they should use Binance.US for trading.*
Related Reading
💡 Register on Binance with referral code B2345 for the maximum trading fee discount. See Binance complete guide.


