
 Bitaigen Research
 What Are Shiba Inu’s All‑Time High and Low Prices?
Shiba Inu (SHIB), a classic meme token, has long attracted investors’ attention with its dramatic price history. Since its launch in August 2020, SHIB has moved from an almost negligible starting price to astonishing peaks, followed by corrections and continued volatility. With a total supply of roughly 589 trillion tokens, its price is heavily influenced by community sentiment, celebrity endorsements, and broader macro‑market factors.
Below, this article provides a detailed review of SHIB’s historical price chart, yearly market snapshots, and an analytical price table. Let’s explore together!

In this piece we systematically trace SHIB’s price trajectory from its birth to the present, linking community hot‑spots, macro‑economic drivers, and on‑chain data. We present a complete historical chart, highlight key inflection points, and compare the characteristics of each market phase. The goal is to help readers objectively understand the volatility logic of meme tokens. Subsequent sections will explore potential influencing factors—stay tuned.
Origin of SHIB and Its Price Foundations
Shiba Inu was created in August 2020 by an anonymous developer known as Ryoshi, drawing inspiration from Dogecoin (DOGE) and aiming to challenge mainstream cryptocurrencies through community power. Its initial price was virtually zero—about $0.000000000056. This reflects the grassroots nature of meme coins: no major team backing, only viral social‑media momentum. SHIB runs on the Ethereum network as an ERC‑20 token, facilitating DeFi integration. Early on, half of the total supply was donated to Ethereum founder Vitalik Buterin, who subsequently burned 90 % of his holdings, providing a catalyst for price appreciation.
Looking at the historical chart, SHIB’s price curve exhibits a classic “pump‑and‑dump” pattern. Overall volatility exceeds 200 %, far surpassing Bitcoin’s. Drivers include social‑media hype (e.g., Elon Musk tweets), exchange listings (e.g., Coinbase), and ecosystem developments (e.g., Shibarium Layer‑2). As of January 29 2026, SHIB traded around $0.0000078, with a market cap of roughly $4.44 billion, ranking 37th globally. Its 52‑week range was $0.00000683–$0.00004555, and over the past 12 months the token fell about 58.62 %.
Overall Analysis of SHIB’s Historical Price Chart
SHIB’s price history can be divided into several pivotal phases:
- Incubation (early 2020–2021)
- Explosion (2021)
- Correction (2022–2023)
- Recovery & Volatility (2024–2026)
According to CoinMarketCap data, the lowest recorded price occurred on November 28 2020 at $0.00000000005637, while the all‑time high (ATH) was $0.00008616 on October 28 2021. That surge represents a 150,000‑fold increase, spawning numerous investment legends.
On platforms such as TradingView, the candlestick chart shows strong speculative traits. The early curve is flat, hugging the X‑axis; 2021 brings exponential growth with massive volume; thereafter a steep decline creates a “V‑shaped” reversal. Technical indicators—RSI frequently entering overbought/oversold zones, MACD crossovers occurring often—reflect sentiment‑driven trading. A long‑term trendline indicates that the bottom has been gradually raised from $0.00000582 in 2022 to roughly $0.000007 in 2026, suggesting a developing support level.
Below is a visual representation of the historical price chart:
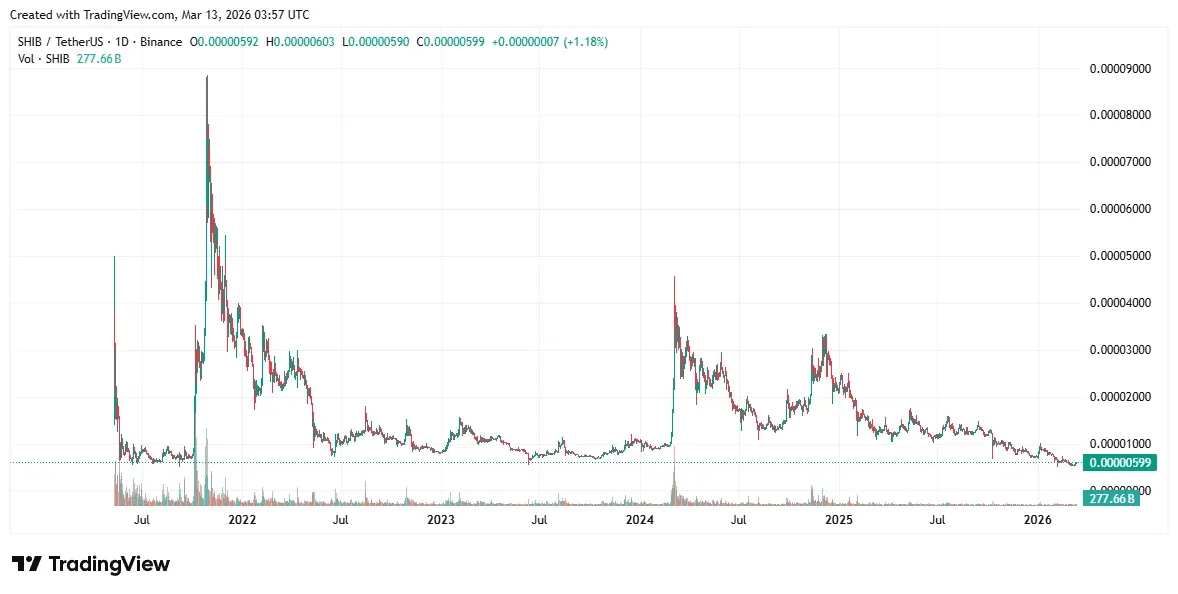
The figure displays the price trajectory from 2020 through 2026, clearly showing the 2021 peak and subsequent pull‑backs.
Year‑by‑Year Price Table and Market Review
Using data from Yahoo Finance, Investing.com, and Traders Union, we compiled a yearly price table that includes opening, high, low, closing prices, and annual returns. Note that 2020 data are limited because SHIB was newly launched.
2020 – The Birth Year, Near‑Zero Prices
2020 marked SHIB’s debut. The opening price was about $0.000000000056, the yearly high never exceeded $0.000000001, the low matched the open, and the close was roughly $0.0000000001. Annual return is essentially zero. Market characteristics included extremely low liquidity, trades confined to niche communities, and negligible volume—resulting in a near‑flat line chart. Key events: Ryoshi released the whitepaper, the early community formed, but broader market attention was minimal, keeping the price at “dust‑level”.
2021 – The Explosive Year, Astronomical Gains
2021 became SHIB’s golden era. Opening price: $0.00000001; peak: $0.00008845 on October 28; low returned to $0.000000000056; close: $0.0000334. Annual return reached several million‑fold. Market recap: early 2021 saw a gradual climb; a May “burn” event by Vitalik triggered the first pump, lifting price from $0.000006 to $0.000035; the second half benefited from ShibaSwap launch and Elon Musk’s tweets, culminating in the October ATH and a market cap briefly exceeding $37 billion. The chart displayed a steep upward slope and explosive volume. The surge was driven by meme‑coin hype and a broader bull market.
2022 – The Correction Year, Bear Market Purge
2022 experienced a sharp downturn. Opening price: $0.0000334; high: $0.0000352; low: $0.0000072; close: $0.0000081. Annual return: ‑75.86 %. The first half was hit hard by the “crypto winter” and the collapse of FTX, pushing the price down more than 90 %. The chart shows a steep descending line with multiple bottoms. Community activity remained high but could not offset macro pressures. By year‑end, SHIB settled near $0.000008, forming a bear‑market floor.
2023 – The Recovery Year, Modest Rebound
2023 opened at $0.0000081, peaked at $0.0000157, hit a low of $0.0000055, and closed at $0.0000104, delivering a +28.22 % annual return. The first half benefited from Bitcoin’s halving expectations, prompting a bounce that reached $0.000015 mid‑year. The chart adopted a wave‑like upward shape with improving volume. Shibarium testnet launch boosted confidence, though regulatory concerns kept volatility alive. By year‑end the price stabilized around $0.00001, indicating recovery signs.
2024 – Bull Market Return, Doubling Growth
2024 was a strong year for SHIB. Opening price: $0.0000103; high: $0.0000456; low: $0.0000085; close: $0.0000211, yielding a +104.35 % return. The approval of a Bitcoin spot ETF sparked market enthusiasm, lifting SHIB alongside. Mid‑year saw an intra‑year high, and the chart recorded multiple pump cycles with record‑breaking volume. Ecosystem expansion—NFTs, gaming integrations—further pushed the price. A minor pull‑back appeared at year‑end, but the overall bullish tone persisted.
2025 – Heightened Volatility, Sharp Pull‑Back
In 2025, SHIB opened at $0.0000211, reached a high of $0.0000250, fell to a low of $0.0000070, and closed at $0.0000071, representing a ‑66.35 % annual return. The first half continued the previous bull momentum, but Federal Reserve rate hikes and geopolitical tensions triggered a market crash, driving the token to its low in the second half. The chart formed a “W” pattern with several false breakouts. Community “burn” events added some positive sentiment but could not outweigh macro headwinds. By year‑end the price steadied, awaiting the next recovery cycle.
2026 (to date) – Gentle Uptrend, YTD Positive
For 2026 so far, the opening price was $0.0000069, the high reached $0.0000102 on January 4, the low matched the open, and the current price sits around $0.000008. Year‑to‑date (YTD) return is +11.76 %. Early‑year modest rebound was supported by Bitcoin’s relative stability. The chart shows a gentle upward slope with moderate volume. Shibarium mainnet optimizations improve utility, yet overall market sentiment remains soft; future direction will hinge on macro data.
Summary of SHIB’s Yearly Price Table
| Year | Opening Price (USD) | High (USD) | Low (USD) | Closing Price (USD) | Annual Return (%) |
|------|---------------------|------------|-----------|----------------------|-------------------|
| 2020 | 0.000000000056 | ~0.000000001 | 0.000000000056 | ~0.0000000001 | — |
| 2021 | 0.00000001 | 0.00008845 | 0.000000000056 | 0.0000334 | +millions |
| 2022 | 0.0000334 | 0.0000352 | 0.0000072 | 0.0000081 | -75.86 |
| 2023 | 0.0000081 | 0.0000157 | 0.0000055 | 0.0000104 | +28.22 |
| 2024 | 0.0000103 | 0.0000456 | 0.0000085 | 0.0000211 | +104.35 |
| 2025 | 0.0000211 | 0.0000250 | 0.0000070 | 0.0000071 | -66.35 |
| 2026 (YTD) | 0.0000069 | 0.0000102 | 0.0000069 | ~0.000008 | +11.76 |
What Were SHIB’s Highest and Lowest Prices in USD?
SHIB’s historical returns highlight extreme volatility. Key figures:
- 2021: SHIB surged from $6.30 × 10⁻⁸ to $0.0000334, a rise of roughly 54,505 %.
- 2022: Price fell to $0.0000081, down about 75.82 % from the prior year.
- 2023: Price rose to $0.0000103, an increase of roughly 27.16 %.
- 2024: Price jumped to $0.0000212, a gain of about 105.83 %.
- 2025 (YTD): Price sits near $0.0000122, reflecting a ‑42.45 % YTD return.
Historical price milestones:
- All‑time high: $0.0000725 in October 2021
- All‑time low: $4.01 × 10⁻⁸ in March 2021
- Best year: 2021, with a 54,505 % increase
- Worst year: 2022, with a severe decline
Past performance is not a reliable predictor of future results, and investing in cryptocurrencies carries risk.
*Note: Depending on your jurisdiction, gains from cryptocurrency trading may be subject to taxation. Consult a tax professional to understand your local obligations.*
| Date | Open | High | Close | Low | Volume |
|------|------|------|-------|-----|--------|
| 2026/03/01 | $0.00000555 | $0.00000608 | $0.00000594 | $0.00000522 | 27.748 M |
| 2026/02/01 | $0.00000683 | $0.00000725 | $0.00000556 | $0.00000507 | 80.056 M |
| 2026/01/01 | $0.00000699 | $0.00001008 | $0.00000683 | $0.00000670 | 111 M |
| … | … | … | … | … | … |
| 2021/12/01 | $0.00004909 | $0.00004997 | $0.00003437 | $0.00002756 | 3.485 B |
| 2021/11/01 | $0.00006861 | $0.00007495 | $0.00004909 | $0.00003500 | 11.575 B |
| 2021/10/01 | $0.00000708 | $0.00008887 | $0.00006862 | $0.00000707 | 10.899 B |
*(Table shows a subset of data; refer to the original source for the full dataset.)*
Technical Analysis of SHIB’s Historical Market
Historical data reveal that SHIB’s price is tightly coupled with market cycles. During bull markets (e.g., 2021, 2024) the token experiences rapid pumps; during bear markets (e.g., 2022, 2025) corrections are deep. Common technical levels:
- Support around $0.000007
- Resistance near $0.00001
Volume tends to move in tandem with price; peak periods saw daily turnover exceeding $1 billion.
Recent charts indicate a downtrend, yet the demand zone near $0.000007 still offers support.
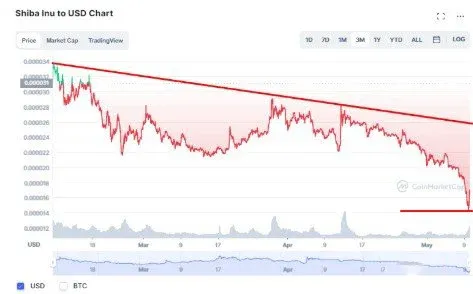
The figure illustrates the descending channel over the past few months, hinting at a possible rebound opportunity.
Future Outlook and Risks for SHIB
Based on historical patterns, SHIB could experience renewed growth during future bull cycles, with an average 2026 price projection of roughly $0.0000076. Primary risks include:
- High volatility
- Regulatory developments
- Competition from similar meme projects
Investors should consider diversified holdings, monitor technical signals, and use appropriate stop‑loss mechanisms.
SHIB’s price journey is not only a trading legend but also a mirror of the broader crypto market’s swings. By reviewing each year, we see both opportunities and pitfalls. Going forward, SHIB will need more real‑world use cases to sustain long‑term value.
Long‑Term Price Forecast for Shiba Inu (2027‑2037
💡 Register on Binance with referral code B2345 for the maximum trading fee discount. See Binance complete guide.



