
This article focuses on the structural changes that occur after Bitcoin falls back into the six‑figure range, interpreting the relationship between sentiment, position sizing, and signals, and offering practical thinking to help investors allocate rationally amid volatility. Subsequent sections will further analyze key support levels and potential breakout points—please continue reading.
Core Summary of the Trading Weekly Report
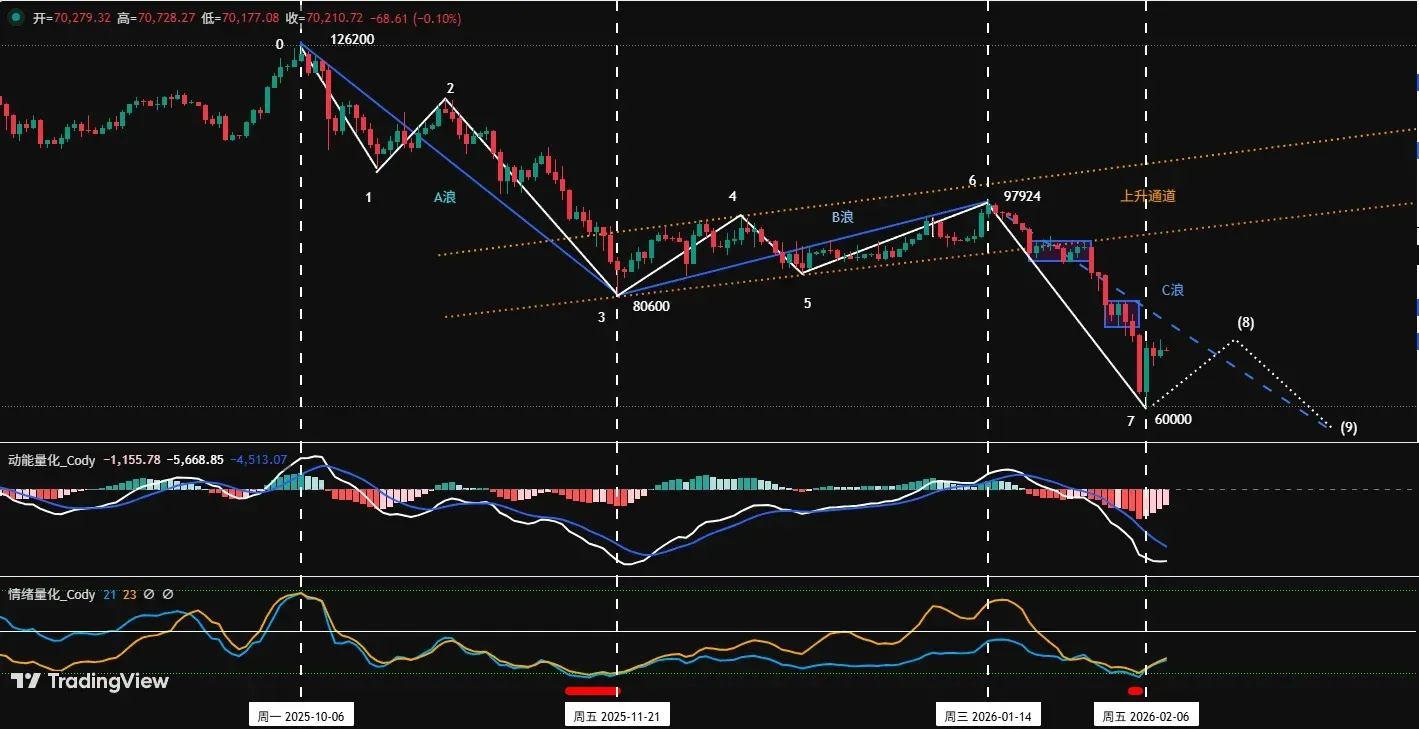
- Internal structure of Bitcoin’s decline wave C since January 14 (see Figure 1).
- Short‑term strategy performance: By following the preset short‑term signals last week, two 1×‑leverage swing trades were completed, delivering a cumulative return of ≈10.72 %.
- Mid‑term strategy performance: The short‑position opened around $89,000 (1× leverage) remains open, having generated roughly 20.97 % profit by last‑week’s close, with a peak gain of 32.58 % during the period.
- Core thesis validation: Within a dual‑timeframe (weekly‑daily) bearish resonance pattern, the price repeatedly pierced key support levels before finally finding support near $60,000, consistent with the expected correction of wave C.

---
1. Thoughts on Sentiment Management and Position Adjustment
Bitcoin’s recent slide to roughly $60,000 has triggered considerable anxiety among investors, especially those who entered near $80,000 or higher. The paper‑loss pressure can be substantial, and emotions often become risk‑driving forces even more than price movements themselves. Rather than chasing short‑term fluctuations blindly, it is wiser to stabilize one’s mindset first, then reassess position size and entry/exit pacing.
If a short‑term bounce materializes, investors can lower overall exposure through two main tactics:
- Staggered reduction – gradually close portions of the position near critical support zones to smooth the average cost.
- Flexible swing trading – employ short‑term models to capture rebound opportunities, entering and exiting quickly while balancing risk and reward.
These approaches can ease paper‑loss stress while preserving capital for the uncertain market ahead.
---
2. Bitcoin’s Structural Correction and the Evolution of Wave C
1. Review of the Primary Structure
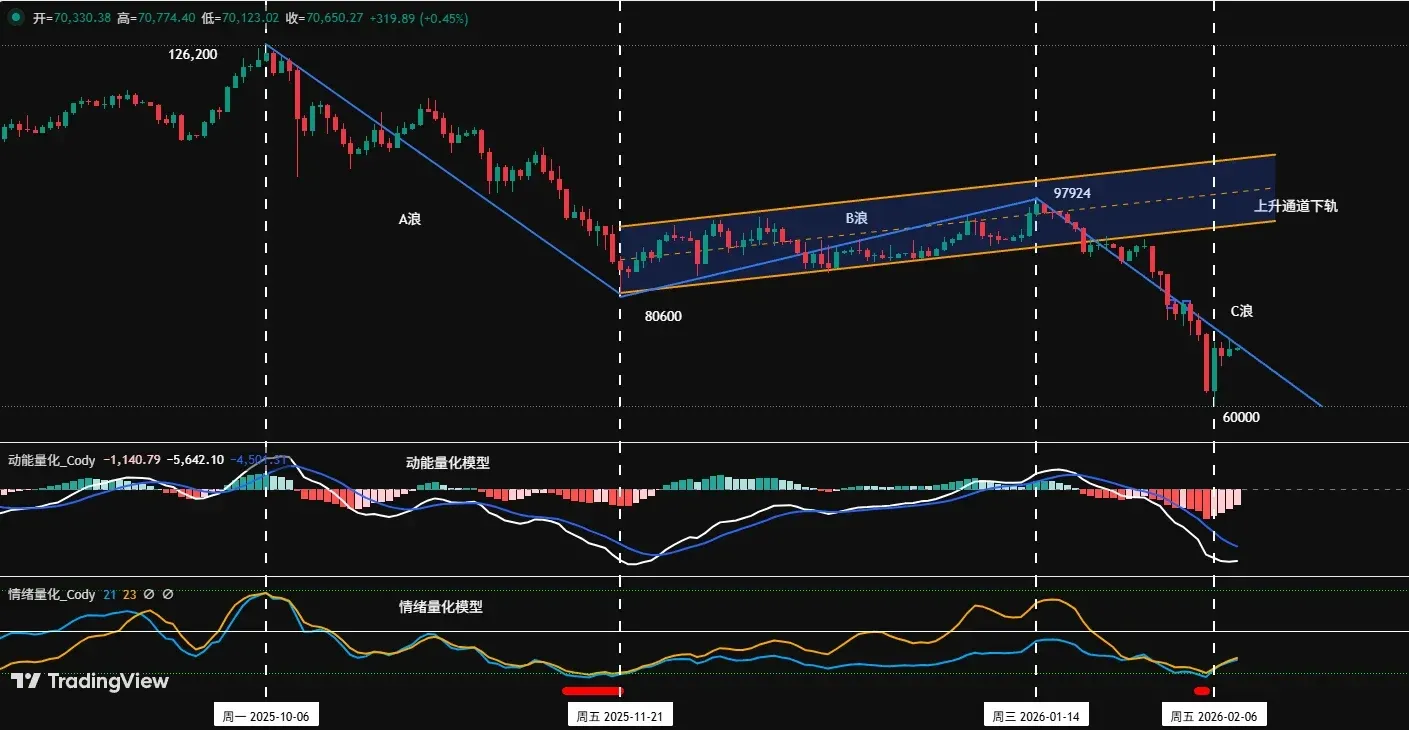
Since the $126,200 peak in October 2025, the current correction can be segmented into an A‑B‑C three‑wave pattern:
- Wave A (down‑move): $126,200 → $80,600, lasting 46 days, a decline of about 36 %.
- Wave B (corrective rally): $80,600 → $97,924, lasting 54 days, an increase of roughly 21.5 %.
- Wave C (principal down‑move): $97,924 → present level, ongoing for 25 days with a cumulative drop of about 38.7 %.
2. Sub‑structure Breakdown
- Wave A can be further divided into three sub‑segments 0‑1, 1‑2, 2‑3, corresponding to the price ranges $126,200‑$103,528, $103,528‑$116,400, and $116,400‑$80,600 respectively.
- Wave B is similarly split into three sub‑segments 3‑4, 4‑5, 5‑6, covering $80,600‑$94,589, $94,589‑$84,450, and $84,450‑$97,924.
3. Three Possible Paths Within Wave C
| Possibility | Structural Feature | Key Range | Remarks |
|---|---|---|---|
| **① 3‑segment pattern (most likely)** | Segments 6‑7 already completed $97,924 → $60,000; segment 7‑8 expected rebound; segment 8‑9 final decline | Below $60,000 may be breached, extending support downward | Rebound resistance around $72,000‑$74,500 and $80,000‑$80,600 |
| **② 5‑segment or more complex (less likely)** | After segment 6‑7, no clear bottom emerges; price may form a descending wedge or multiple three‑wave clusters | Extension of correction time | Could be triggered by worsening macro conditions or liquidity squeeze |
| **③ V‑shaped rapid reversal (very low probability)** | Segment 6‑7 finishes, then segment 7‑8 produces a strong rally breaking above $97,924 | Requires a major positive catalyst | If realized, the entire A‑B‑C could close in a simplified shape near $60,000 |
Note: The above scenarios are logical conjectures; actual market behavior always follows “the market is always right.”
---
3. Review of Last Week’s Trades (02 Feb – 08 Feb)
1. Short‑Term Operations
Using our proprietary price‑difference trading model and momentum‑quantitative model, two short‑term short positions were executed on the 30‑minute / 60‑minute timeframes, achieving a total profit of 10.72 % (1× leverage).
- First trade: After resistance near $80,000, a 30 % short was entered at $77,808, with a stop‑loss at $81,000. The position was closed at $74,930, netting 3.69 % profit.
- Second trade: Following resistance near $69,000, a 30 % short was opened at $68,311, stop‑loss set at $71,000. The trade exited at $63,502, delivering 7.03 % profit.
*(Note: Cryptocurrency gains may be taxable in your jurisdiction; consider local tax regulations.)*
2. Mid‑Term Position
The 60 % short opened around $89,000 remains in place, having accumulated approximately 20.97 % profit since its inception on January 14, with a peak gain of 32.58 %.
3. Key Levels Recap
- Resistance zone: $80,000‑$80,600
- First support: $72,000‑$74,500
- Second support: $69,000‑$72,500
---
4. Technical Diagnosis for This Week (09 Feb – 15 Feb)
Weekly Perspective
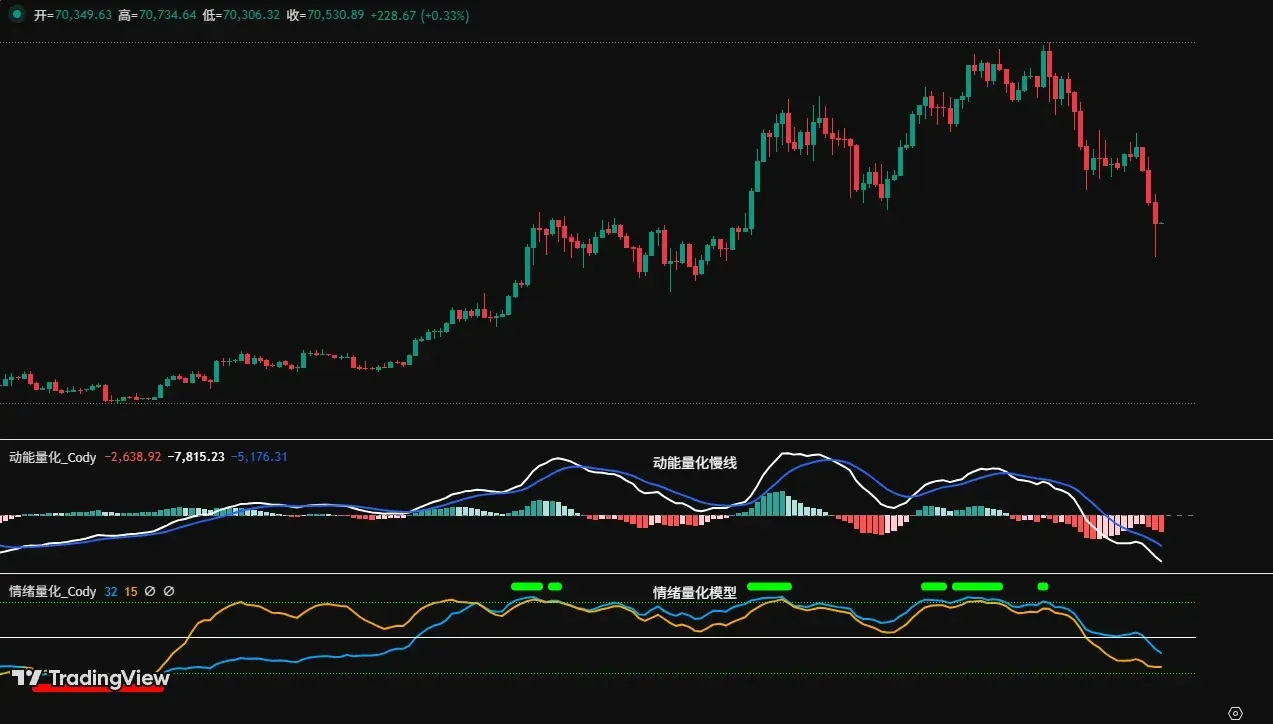
- The momentum‑quantitative model shows that short‑side momentum continued to discharge last week; both momentum lines moved down in tandem, and the negative energy bars expanded, indicating an accelerating decline.
- The sentiment‑quantitative model registers a blue‑line value of 38 and a yellow‑line value of 11, both at zero intensity, suggesting a neutral market mood.
- The digital‑monitoring model did not generate a bottom‑signal; the weekly candlestick closed with a long lower shadow and a large bearish body, down about 8.63 %.
Conclusion: The weekly chart remains bearish, although short‑term momentum shows a brief weakening.
Daily Perspective
- The momentum model displayed an “accelerating decline → bottom‑rebound” pattern last week; the white line’s descent slowed, and negative energy bars contracted for three consecutive days.
- The sentiment model triggered a bottom‑warning (red dot) after the Sunday close, followed by upward turns in both sentiment lines.
Conclusion: Daily outlook stays bearish, but a bottom‑warning has emerged, hinting that a short‑term rebound may be underway.
---
5. Market Outlook and Operational Guidance for This Week (09 Feb – 15 Feb)
1. Key Observation Points
- Break below $60,000?: A breach would imply that segment 6‑7 of wave C is still in progress, and the anticipated rebound has not yet started.
- Resistance levels:
- First tier: $72,000‑$74,500 (April 2023 low)
- Second tier: $80,000‑$80,600 (initiation zone of wave B)
- Support levels:
- First tier: $60,000‑$62,500 (recent trough)
- Second tier: $57,400 (near the 210‑day moving average)
- Critical support: $52,500 (symmetrical point of wave A’s decline)
2. Mid‑Term Position Management
- Keep the 60 % short exposure. If price decisively breaks above $74,500 and holds, consider scaling the short down to 40 %.
3. Short‑Term Operational Framework
- Position size: Allocate 30 % of capital to price‑difference trades, placing stop‑losses based on the identified support/resistance zones.
- Two contingency plans:
Plan A – Target $74,500‑$75,200
- Upon a resistance signal, initiate a 15 % short; set stop‑loss roughly 1.5 % above entry cost.
- Gradually close the position as price reaches key support and the model issues a bottom signal.
Plan B – Target $80,000‑$80,600
- Similarly, open a 30 % short after a top signal at the resistance zone; stop‑loss as above.
- Take partial profits in stages when price retreats to support levels and receives model confirmation.
4. Risk‑Control Essentials
- Place a stop‑loss immediately upon entry.
- When profit reaches 1 %, move the stop‑loss to breakeven to protect capital.
- At 2 % profit, shift the stop‑loss to lock in a 1 % gain.
- For every additional 1 % of profit thereafter, raise the stop‑loss by 1 %, creating a dynamic protective ladder.
---
6. Closing Remarks
Bitcoin’s return to the low‑$60,000 region marks a deep overshoot correction. The market is currently in a pivotal phase of scouting for bottoming signals and gauging the strength of any forthcoming rebound. Regardless of how the price evolves, maintaining composure, adhering to model‑driven signals, and adjusting positions flexibly constitute a prudent pathway through volatility. For further technical analysis and trading ideas on Bitcoin, stay tuned to Bitaigen’s upcoming publications.
*U.S. residents should access cryptocurrency markets through Binance.US or other regulated platforms.*
*(Note: Crypto gains may be subject to taxation under local laws; consult a tax professional for guidance.)*
Related Reading
- Bitcoin Flywheel Failure: Recovery Strategies & Options
- Strategy Adds $962M to Reach 660k Bitcoin BTC Reserve
- Bitcoin Reaches 20 Million Coins Minted – Scarcity Milestone
💡 Register on Binance with referral code B2345 for the maximum trading fee discount. See Binance complete guide.


