
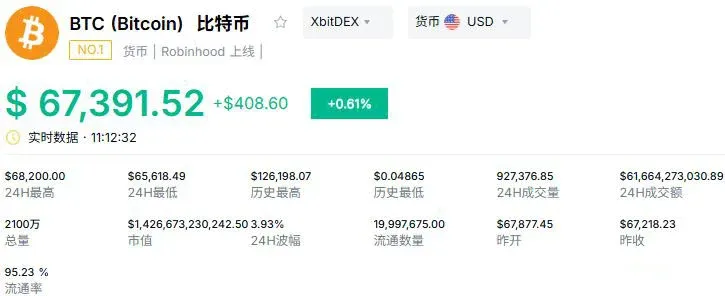
Latest market data shows that after the 2026 Bitcoin halving, there has been no sign of a recovery. Instead, the price has slipped below the psychologically significant $70,000 threshold and entered a deep bear market. The most recent quote on March 9 was $67,391. In response to this downtrend, various industry institutions have issued warnings, suggesting that Bitcoin could fall another roughly 30 % this year. The following sections combine authoritative research reports, on‑chain key metrics, and technical models to provide a multi‑dimensional analysis of the potential bottom range.

Forecast Dimensions – Key Indicators / Institutions Pointing to a Bottom Range (USD)
- Core logic
- Institutional forecasts
- Standard Chartered $50,000
- ETF outflows and macroheadwinds
- Technical analysis $42,000
- Peter Brandt “banana‑skin” long‑term support model
- On‑chain cost $45,000
- CVDD model Long‑term holder accumulated‑cost floor
- Production cost $77,000
- JPMorgan Current price already below; watch hashrate changes
In this article we synthesize institutional research, on‑chain data, and technical models to paint a full‑picture view of where Bitcoin’s bottom could lie during the deep‑bear phase of 2026. The goal is to help readers clarify the risk factors and support zones that matter. Subsequent sections will reveal which signals merit close attention—please continue reading.
Main‑stream Institutional Alerts: $50 000 Becomes a Critical Psychological Defense Line
Standard Chartered’s Warning
Geoff Kendrick, Head of Digital Asset Research at Standard Chartered, recently noted that ongoing ETF capital outflows together with adverse macro conditions could push Bitcoin back toward roughly $50,000 over the next few months. With the current price at $67,391, this implies about a 24 % downside potential. This view is echoed by the founder of crypto hedge fund ZX Squared Capital, and both parties estimate a year‑end decline of around 30 %, underscoring that institutional capital flows have become a core driver of price volatility.
JPMorgan’s Cost Perspective
In contrast to Standard Chartered’s bearish outlook, JPMorgan offers a different angle: it estimates Bitcoin’s production cost at roughly $77,000 per coin, a level traditionally regarded as a “soft price floor.” The market has already slipped beneath this cost line, indicating that miners are experiencing compressed margins. Should the price stay below cost, miners may be forced to exit; conversely, a price rebound above cost would restore mining profitability and help stabilize the network’s total hashrate.
Technical‑Analysis‑Driven Models
Veteran chartist Peter Brandt applies his “banana‑skin” model and predicts that, if history repeats, Bitcoin’s floor could settle near $42,000. On‑chain analyst @ali_charts adds that Bitcoin is approaching its 200‑week moving average, a zone that has repeatedly acted as a convergence point for bear‑market bottoms over the past twelve years. The $62,500 region is also widely viewed by market participants as a key support level. Together, these technical cues sketch a potential descending channel and remind investors to watch for downside risk on the chart.

Where Is the True Price Floor in This Deep Bear Market?
The Reality of Miner Production Costs
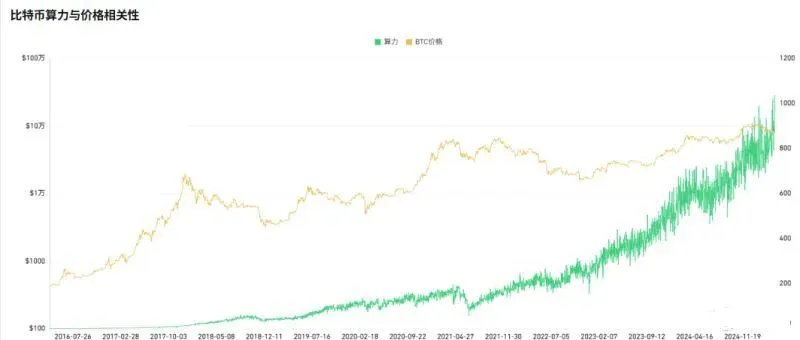
JPMorgan’s latest data show that the global average fully‑absorbed cost for mining a Bitcoin has risen to about $87,000, while the current market price hovers around $68,000. This translates to an average loss of roughly $19,000 per coin for miners. A VanEck report notes that the network’s total hashrate fell by approximately 14 % over the past 90 days; exits by high‑cost miners often precede an eventual improvement in overall returns.
Dynamics of Long‑Term Holders
On‑chain metrics reveal that in 2025 long‑term holders moved 7‑8 million BTC out of their wallets. However, after the start of 2026 the total supply held by these long‑term addresses rose from 13.63 million BTC to roughly 13.81 million BTC. This suggests that core coins have not been subject to massive liquidation, and selling pressure is largely coming from short‑term speculators. Such a structural improvement provides a modest cushion for the floor and eases the extreme “another 30 % drop” narrative.
Quantitative Model Cost Line
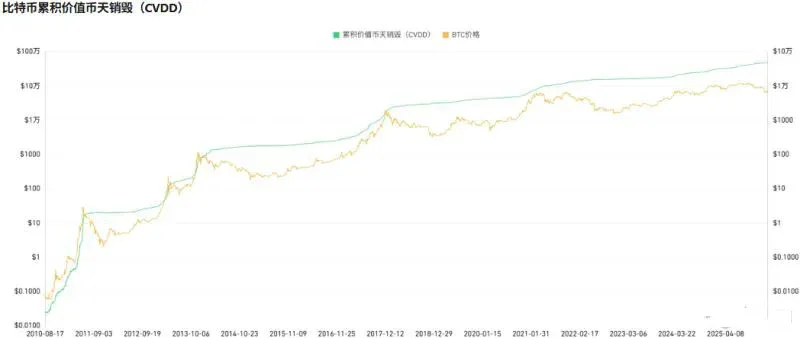
Chinese on‑chain analyst Murphy calculates the Cumulative Value‑Decline‑Days (CVDD) index at about $50,016, climbing at roughly $540 per month. Historically, the CVDD has never been decisively breached, forming a hard‑to‑cross cost floor. When combined with the technical analysis‑derived $42,000 zone, the CVDD‑indicated range of $45,000‑$50,000 (or a slightly higher practical floor) becomes a focal point for bottom‑price expectations.
Conclusion: Patience and Liquidity Are Paramount
A research note from Matrixport points out that even though Bitcoin has slipped below $60,000, the genuine bottom‑picking moment may still be pending. The monthly stochastic indicator sits around 39 %, still above the deep‑oversold threshold of 15 %. Based on the multi‑dimensional analysis presented, the ultimate floor is likely to lie somewhere below $50,000 and above the 200‑week moving average. Only when trading volume contracts sharply, miner hashrate continues to decline, and technical indicators show a clear divergence will a true bottom signal emerge.
During this period, maintaining sensible cash liquidity and avoiding blind “chasing the top” will help investors navigate the potentially severe bear market that 2026 could bring. For a deeper dive into Bitcoin’s deep‑bear dynamics, stay tuned to Bitaigen (比特根) for follow‑up coverage.
*Note for global readers:* All fiat references are in USD; transactions across borders typically use SEPA (for Euro) or SWIFT for other currencies. U.S. residents must conduct spot‑trading on Binance.US rather than the global Binance platform. Additionally, be aware that cryptocurrency gains may be subject to taxation in your local jurisdiction, so consider consulting a tax professional.
💡 Register on Binance with referral code B2345 for the maximum trading fee discount. See Binance complete guide.


