
March 2026 – Binance Chain (BNB) Breaks the Key Resistance of $636 and Faces the Test of Holding $670 This Month
The primary question for the market is whether BNB can consolidate above the $670 level throughout March after its strong breakout. This article examines the possible price trajectory from three perspectives: macro‑fund flows, the emerging AI‑agent economy, and technical chart patterns, providing readers with a systematic reference.
From the angles of macro‑fund environment, AI‑agent economy, and technical formation, we conduct an in‑depth analysis of BNB’s critical support after the recent breakout and the potential risks ahead. By combining data and case studies, readers can capture the key signals of price movement and understand how the subsequent trend may evolve.
---
Macro Environment and Potential Risks
The United States’ Clarity Act has been gradually implemented, injecting confidence into the regulatory compliance of crypto assets and warming overall risk appetite. Nevertheless, BNB still confronts two major hurdles if it is to stay above $670 in March:
- Short‑seller pressure in the futures market remains vigorous. In the past 24 hours, the total number of liquidations across all platforms reached 126,100, indicating an intense battle between longs and shorts.
- Trading volume must keep pace with the price rally. Should volume dry up as the price approaches $670, a pull‑back toward the $636 breakout level—or even down to $600—could occur as the market searches for fresh support.
Most analysts now view the $667‑$670 zone as the critical target for this month. Whether BNB succeeds or fails will become evident in the coming days.
---
The Rise of the AI‑Agent Economy Adds New Momentum to BNB
At the beginning of March, the BNB Chain launched a production‑grade AI‑agent toolkit built on the MCP Skill repository and the ERC‑8004 standard. This enables AI agents to autonomously read on‑chain data, manage wallets, and execute live trades. Since the standard’s release, more than 20,000 AI agents have been deployed across multiple blockchains, including BNB Chain, covering 10 major categories and 58 projects.
As the native token used to pay gas fees, BNB’s demand is expanding from traditional manual transactions to 24/7 AI‑driven automated interactions. The incremental on‑chain activity powered by AI agents provides BNB with a distinctive long‑term value foundation that differs from other public chains. This is a core reason why the market anticipates a possible breakthrough of $670 and even a push toward $790.
Note for U.S. readers: To trade BNB, U.S. residents should use Binance.US, which operates under separate regulatory constraints from the global Binance platform.
---
Technical Analysis
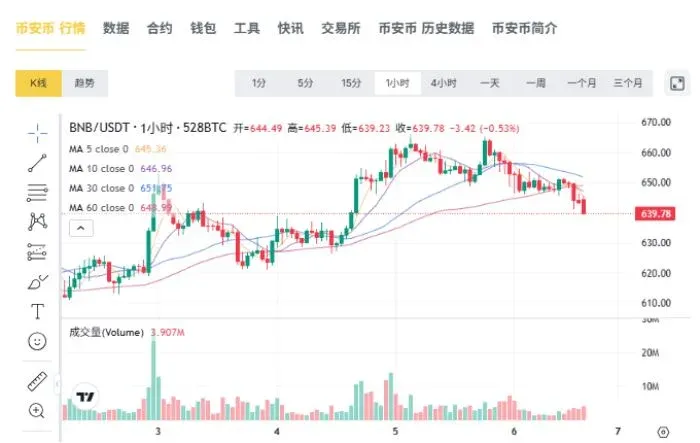
On 4 March 2024, BNB’s daily chart saw the price cross above the 20‑day Exponential Moving Average (EMA) situated at $636, effectively dismantling the short‑term bearish pattern. The breakout was accompanied by a noticeable surge in volume, confirming that buying pressure had entered the market.
By mid‑March, BNB entered a liquidity‑hunt zone. The $670 level is not only a psychological barrier but also coincides with a previously dense cluster of trade activity. Around $657, the price aligns with the 0.618 Fibonacci retracement, creating a relatively strong resistance pocket. To hold above $670, BNB must decisively break through the $657‑$670 resistance band. If the token can consolidate above $636 and form a stable sideways range, the probability of advancing toward $730—or higher—within the month rises significantly.
---
Long‑Term Price Forecast (2026 – 2037)
| Year | Potential Low ($) | Average ($) | Potential High ($) |
|---|---|---|---|
| 2026 | 279.01 | 618.88 | — |
| 2027 | 268.60 | 487.11 | 705.62 |
| 2028 | 484.75 | 836.03 | 1,187.31 |
| 2029 | 1,064.86 | 2,283.89 | 3,502.92 |
| 2030 | 905.62 | 1,762.01 | 2,618.41 |
| 2031 | 1,070.72 | 1,730.52 | 2,390.31 |
| 2032 | 1,634.38 | 3,034.14 | 4,433.91 |
| 2033 | 3,797.94 | 7,804.14 | 11,810.34 |
| 2034 | 3,053.36 | 4,946.64 | 6,839.91 |
| 2035 | 3,610.02 | 5,834.57 | 8,059.12 |
| 2036 | 5,975.72 | 11,324.92 | 16,674.12 |
| 2037 | 15,518.77 | 27,669.07 | 39,819.38 |
- 2026: The projected range is $279.01 – $618.88. Reaching the upper bound would represent roughly a 0.63 % increase over the current price level.
- 2027 – 2032: The interval shifts upward to $268.60 – $4,433.91, with the high end implying a potential 393.37 % cumulative gain.
- 2032 – 2037: The highest forecast peaks at $27,669.07, corresponding to an overall growth of about 4,399.18 %.
These figures are for informational purposes only and do not constitute investment advice.
BNB 2026 Price Outlook
The average price is expected to fluctuate within $279.01 – $618.88. If the upper limit is attained, the annual growth would be around 0.63 %.
BNB 2027‑2032 Price Band
The low‑end projection is $268.60, while the high‑end reaches $4,433.91, allowing for a cumulative increase of up to 393.37 %.
BNB 2032‑2037 Long‑Term Projection
The range expands from $3,034.14 to $27,669.07. Achieving the top figure would mean a total appreciation exceeding 4,300 %.
Tax reminder: Crypto gains may be taxable in your jurisdiction. Consult a local tax professional to understand your obligations, especially when converting to fiat via SEPA, SWIFT, or other banking channels.
---
Summary
After breaking the $636 barrier, BNB’s ability to stay above $670 in March hinges on two key factors:
- Defense of the $636 support level together with sufficient trading volume.
- Sustained demand generated by the AI‑agent economy on the BNB Chain.
If both elements align, BNB could unlock further upside. Conversely, a lack of volume or a resurgence of short‑seller pressure may trigger a retreat below $600, raising downside risk.
Investors should monitor on‑chain activity, ETF inflows, and other macro indicators to capture structural opportunities while implementing appropriate risk controls.
*This concludes the full translation of “2026 Binance Coin (BNB) Price Forecast: After Breaking $636, Can It Hold $670 in March?” For additional BNB analyses, please refer to previous Bitaigen (比特根) articles or the related readings listed below. Thank you for following and supporting our work.*
💡 Register on Binance with referral code B2345 for the maximum trading fee discount. See Binance complete guide.
⚠️ Risk Disclaimer: Crypto prices are highly volatile. This is not investment advice.


