

In this article we systematically outline a fundamental‑analysis framework for cryptocurrencies, borrowing concepts from traditional financial statements and key metrics, and interpreting value from technical, ecosystem, and supply‑and‑demand perspectives. Through case studies we demonstrate how to turn these elements into investment references, helping you stay rational in a highly volatile market. For the complete evaluation methodology, keep reading.
Introduction
All forms of trading carry risk. You often hear the saying “one day in the crypto world feels like ten years in the real world.” Traditional stock markets impose daily price‑movement limits; if a price exceeds the allowed range trading is halted to prevent excessive profit or loss. In the emerging crypto market there are neither price caps nor time caps—trading occurs 24/7, and there is no concept of a market “close.” Unlimited possibilities come with equal risk. In a high‑reward, high‑risk environment, what methods can investors use to make more rational crypto‑investment decisions?
What Is Fundamental Analysis?
In traditional financial markets, investors make decisions based on stock‑price movements, and sound decisions rely on appropriate analytical methods. The most common approaches are divided into three categories: fundamental, technical, and sentiment (or “chip”) analysis. Traditional equity fundamental analysis depends on the “three major financial statements” and “four key ratios” to uncover a listed company’s financial health, assess its profitability, and evaluate whether it is suitable for long‑term investment.
- The Three Major Financial Statements
- Comprehensive Income Statement – Used to determine whether the company has generated net profit.
- Balance Sheet – Shows the company’s assets and liabilities.
- Cash‑Flow Statement – Examines the actual liquid cash the company possesses.
- The Four Key Ratios
- Earnings Per Share (EPS) – Reflects profit earned per share.
- Price‑Earnings Ratio (PE) – Estimates how long it would take for the stock price to equal earnings.
- Operating Gross Margin – Measures the profit level of the company’s products.
- Price‑Book Ratio (PB) – Assesses whether the share price is reasonable relative to book value.
Whether in traditional equities or the nascent crypto market, the core of fundamental analysis is to evaluate whether an asset’s price is over‑ or undervalued.
Cryptocurrencies and Fundamental Analysis
Cryptocurrencies differ from traditional equities in that project teams rarely publish quarterly financial statements; consequently, the three major statements and four key ratios lose much of their relevance. Traditional fundamental‑analysis techniques therefore do not map directly onto crypto assets.
Because of decentralisation, cryptocurrencies lack a unified measurement standard. The market is flooded with noisy information, and “rumor mill” reports are often difficult to verify. Investors must filter out potentially manipulated data and select reliable indicators to gauge the credibility of information sources. For example, messages posted on Twitter or Telegram may be false, and a sudden surge in active on‑chain addresses could be the result of “watered‑down” activity.
So, which metrics and tools are suitable for the crypto space, and how can they be combined with news flow to form an effective fundamental‑analysis decision‑making process? The following sections explore three basic on‑chain measurements, three key ratios, commonly used analytical tools, and essential points for interpreting market news.
Three Basic Measurements
1. On‑Chain Metrics
On‑chain metrics are indicators derived from blockchain data that help assess the health of a network. Collecting data from every node individually is time‑consuming and costly; therefore, it is advisable to use dedicated information platforms built for investment decisions or to retrieve data via an API (Application Programming Interface).
- Transaction Count
Used to gauge network activity. By observing the number of transactions over a given period, one can identify trends in on‑chain usage. Beware of artificially generated transactions, such as transfers between addresses owned by the same entity.
- Transaction Value
Unlike transaction count, transaction value represents the total amount transferred across all transactions within a specific timeframe. It is calculated by summing the monetary value of each transaction.
- Active Addresses
Addresses that have sent or received at least one transaction within a defined time window. The common method is to count unique sender and receiver addresses during the period and aggregate them over time to spot trends.
- Fees Paid
When a blockchain becomes congested, users raise fees to accelerate confirmation; when the network is smooth, fees drop. Fee levels directly reflect demand pressure—higher demand leads to higher fees.
- Hashrate (Mining Power) and Staked Amount
The consensus algorithm determines how nodes are ordered and is critical for a chain’s security and stability.
- Proof‑of‑Work (PoW) – e.g., Bitcoin; a higher hashrate raises the cost of a 51 % attack.
- Proof‑of‑Stake (PoS) – Validators lock up assets to participate in block validation; the amount staked can indicate market confidence in the project.
2. Project‑Level Metrics
Project‑level metrics focus on the performance of the development team and the progress of the codebase.
- Whitepaper
Analogous to a traditional prospectus, it details the technical rationale, use cases, roadmap, token‑supply mechanics, and other essential information.
- Team
Most projects list member profiles on open‑source platforms such as GitHub. Reviewing the backgrounds and prior projects of team members helps judge whether they possess the capability to deliver on promises.
- Competitors
After researching the whitepaper and team, compare the project with peers in the same niche to evaluate substitutability and competitive advantage.
- Token Economics and Initial Distribution
Examine whether the token has a real utility, whether its monetary model is sensible, and the proportion of tokens held by founders and investors. If the token was issued via an ICO, IEO, or similar mechanism, also assess the planned use of the raised funds.
3. Financial‑Level Metrics
Crypto‑financial metrics differ from traditional finance; they focus more on protocol‑level reward structures.
- Market Capitalisation (Network Price)
Calculated as circulating supply × current price. Market cap is influenced by issuance, token burns, lost coins, and can be overstated. Nevertheless, it remains a common reference for a network’s potential scale.
Example: Bitcoin price $20,669, circulating supply 19,087,475 → market cap ≈ $393.9 billion.
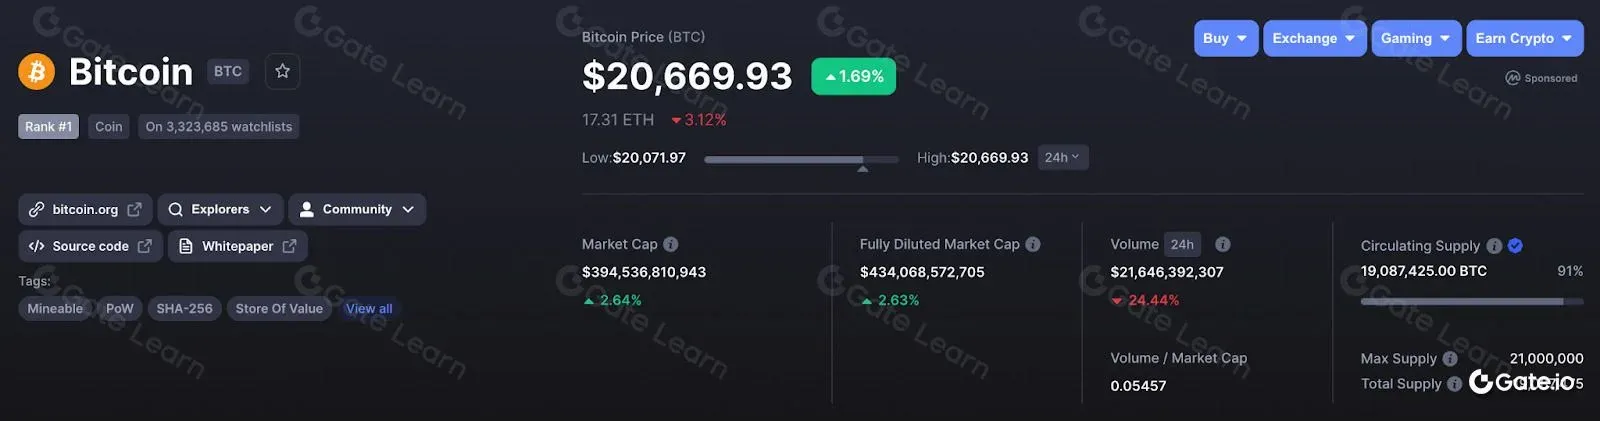
*By CoinMarketCap*
- Liquidity and Trading Volume
Liquidity measures how easily an asset can be bought or sold without affecting its price; trading volume is a key proxy for liquidity. By monitoring the total trade value and the number of trades over a period, one can infer market preference.
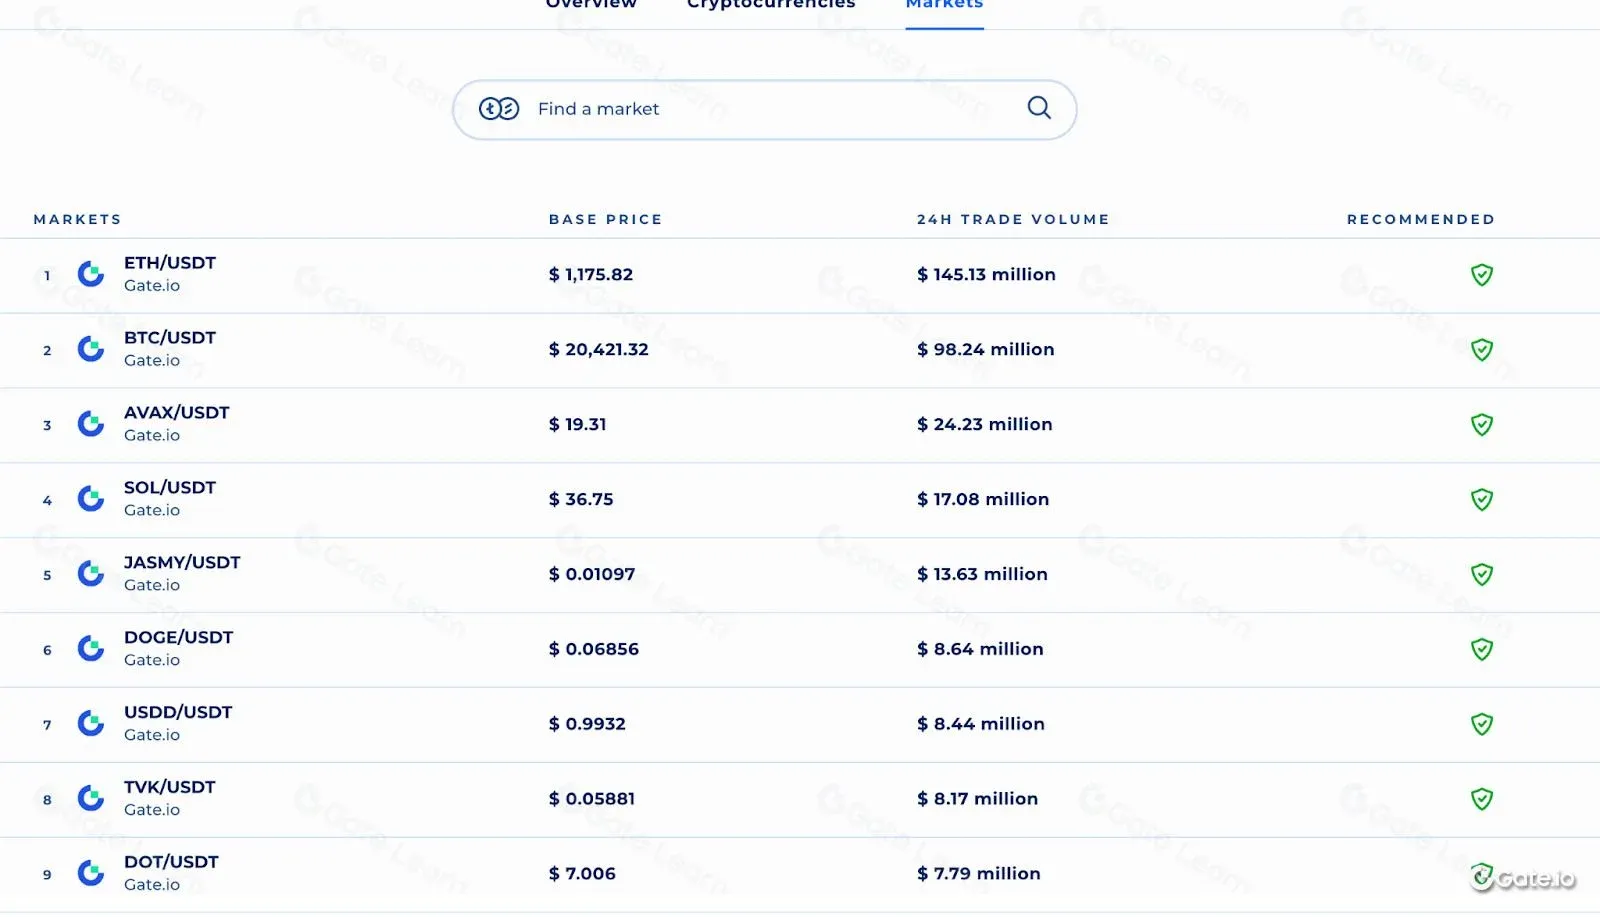
*Gate.com Markets List & Trading Pairs – By Volume | Coinranking*
- Supply Mechanism
Maximum supply, circulating supply, and inflation rate directly impact price. If supply keeps growing while demand stays flat, price usually declines. Some projects employ halving or burn mechanisms to control supply and preserve value.
Three Key Ratios
1. Market Capitalisation (MC) vs. Fully Diluted Valuation (FDV)
Assume a token trades at $1, has 1,000 units in circulation, and a maximum supply of 10,000 units.
- Fully Diluted Valuation (FDV)
FDV = Max supply × Current price = 10,000 × 1 = $10,000.
FDV represents the potential market value if all tokens were unlocked at today’s price.
- Market Capitalisation (MC)
MC = Circulating supply × Current price = 1,000 × 1 = $1,000.
MC reflects the current market value, counting only tokens that are already in circulation.
The main distinction is whether locked or unvested tokens are included. MC is better for gauging present market demand, while FDV leans toward a supply‑side assessment. A large gap where FDV » MC may signal significant selling pressure once the remaining tokens unlock.
2. Total Value Locked (TVL)
TVL measures the total value of assets locked in a DeFi protocol. A higher TVL indicates that more capital is attracted to the protocol, suggesting greater growth potential. Popular reference platforms include DeFi Llama.
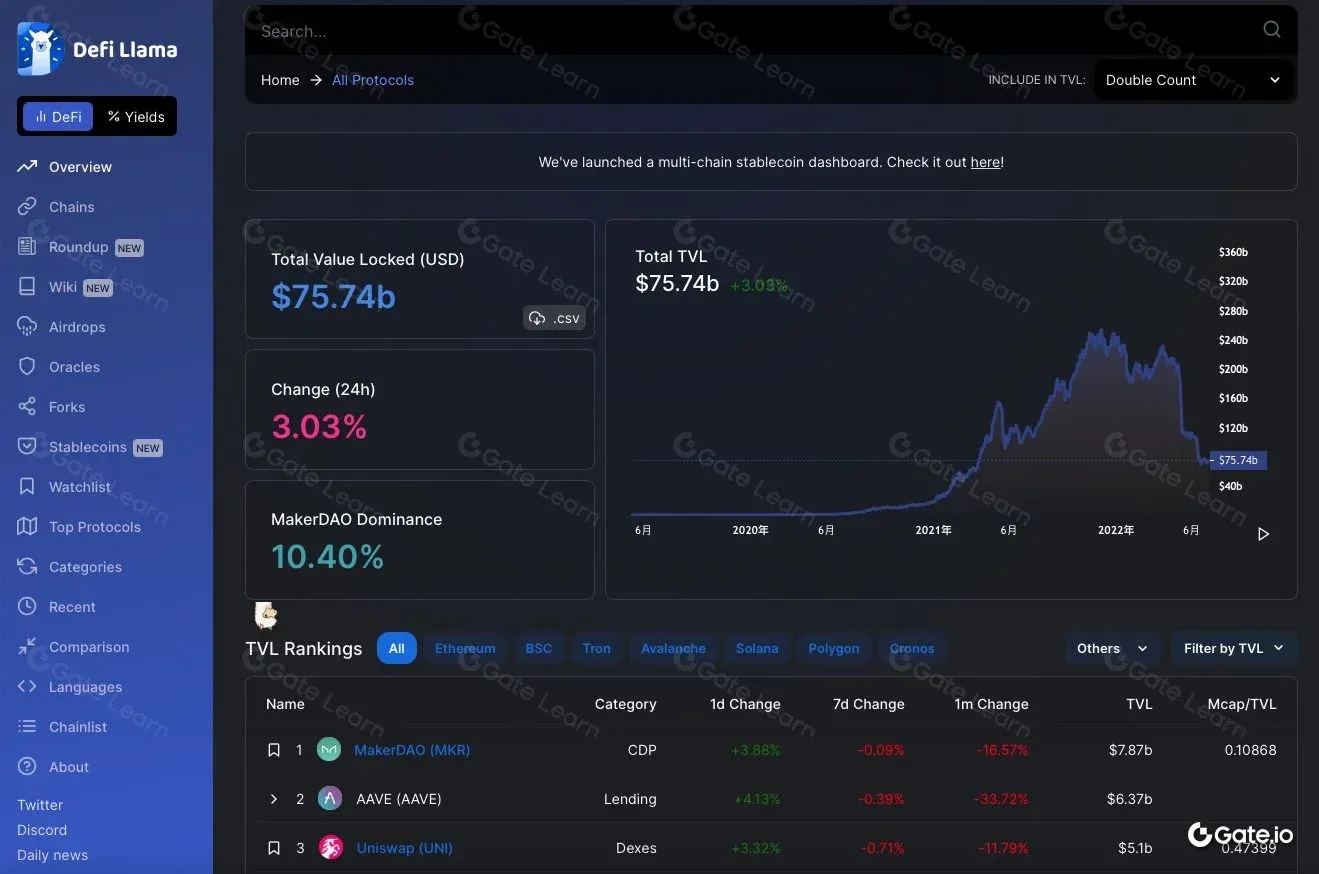
*by: defillama*
Common TVL‑related evaluations:
- Absolute TVL – The larger the number, the healthier the DeFi protocol appears.
- Market‑Cap / TVL – A lower ratio suggests the market is valuing the project modestly relative to its locked capital, implying upside potential.
- Volume / TVL – A higher ratio indicates more efficient use of the locked assets.
3. Protocol Revenue (Profitability)
Protocol revenue refers to the portion of fees paid by users that is allocated to token holders. Different projects have distinct revenue models; the following NFT‑focused examples illustrate the concept.
- Play‑to‑Earn: Axie Infinity
This Ethereum‑based NFT game rewards players with governance tokens for battles and quests. According to CryptoSlam, Axie Infinity’s cumulative sales have surpassed $1 billion, and all protocol revenue flows to token holders, creating a positive correlation between token price and revenue.
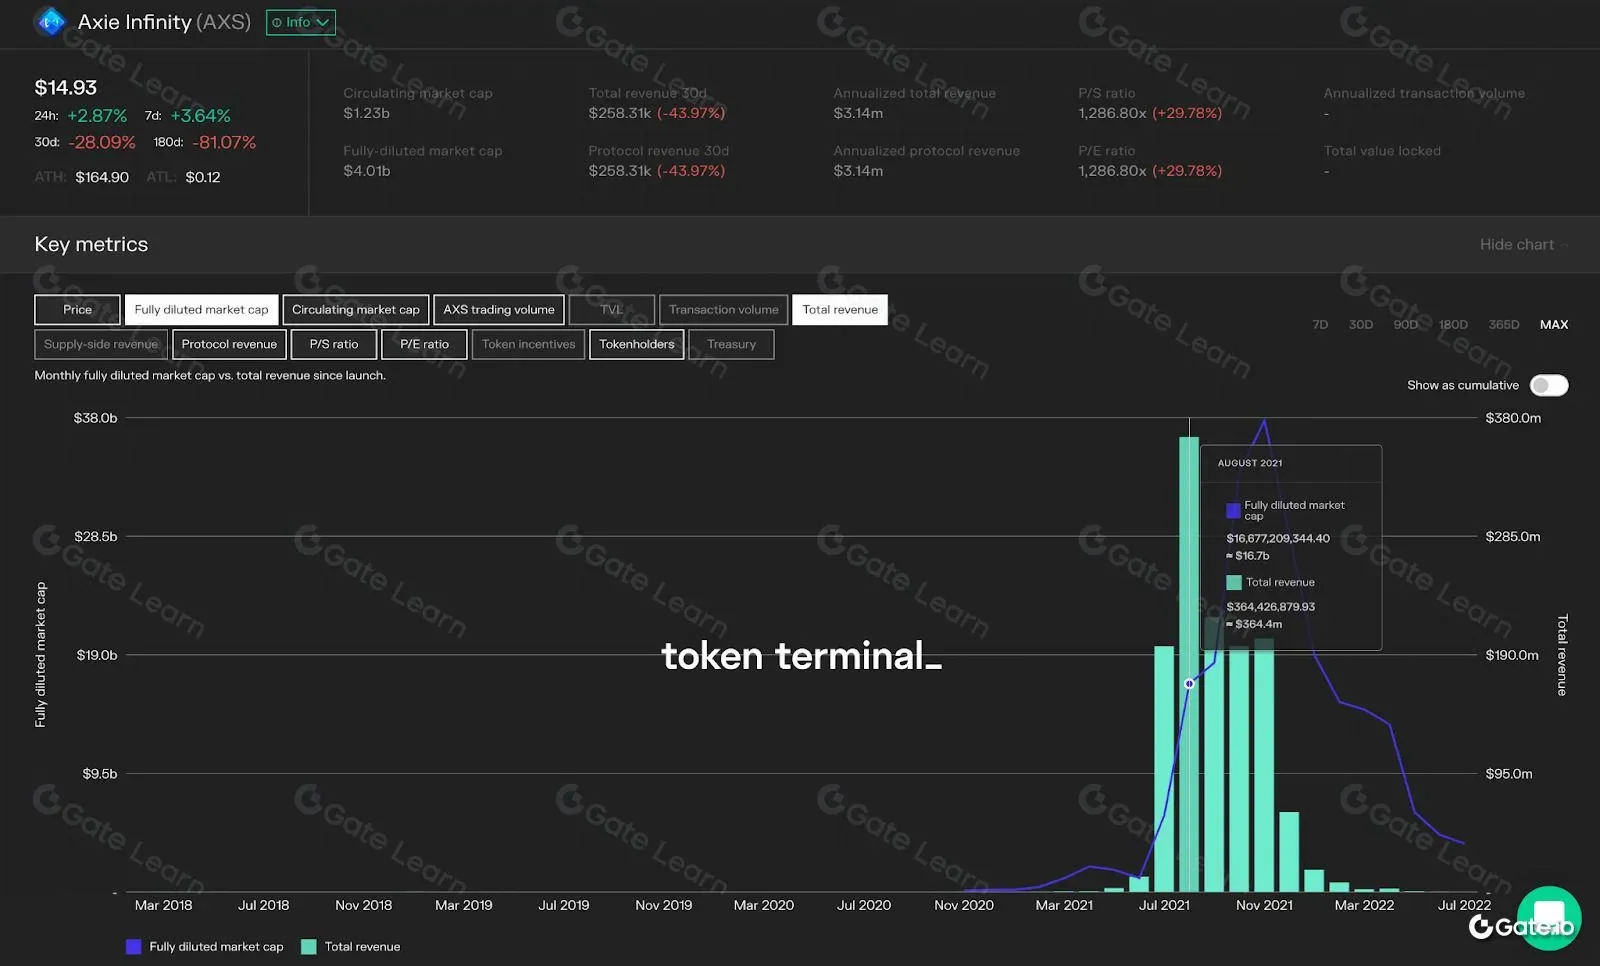
*By token terminal*
- Move‑to‑Earn: STEPN
STEPN uses a dual‑token + NFT model; users own virtual sneakers and earn tokens by completing running tasks. The project closed a seed round in December 2021 and announced a quarterly revenue of $26 million in April 2022, with roughly 800 k daily active users (DAU) and 3 million monthly active users (MAU). Daily revenue ranges between $3 million and $5 million, with peak monthly revenue reaching $100 million.
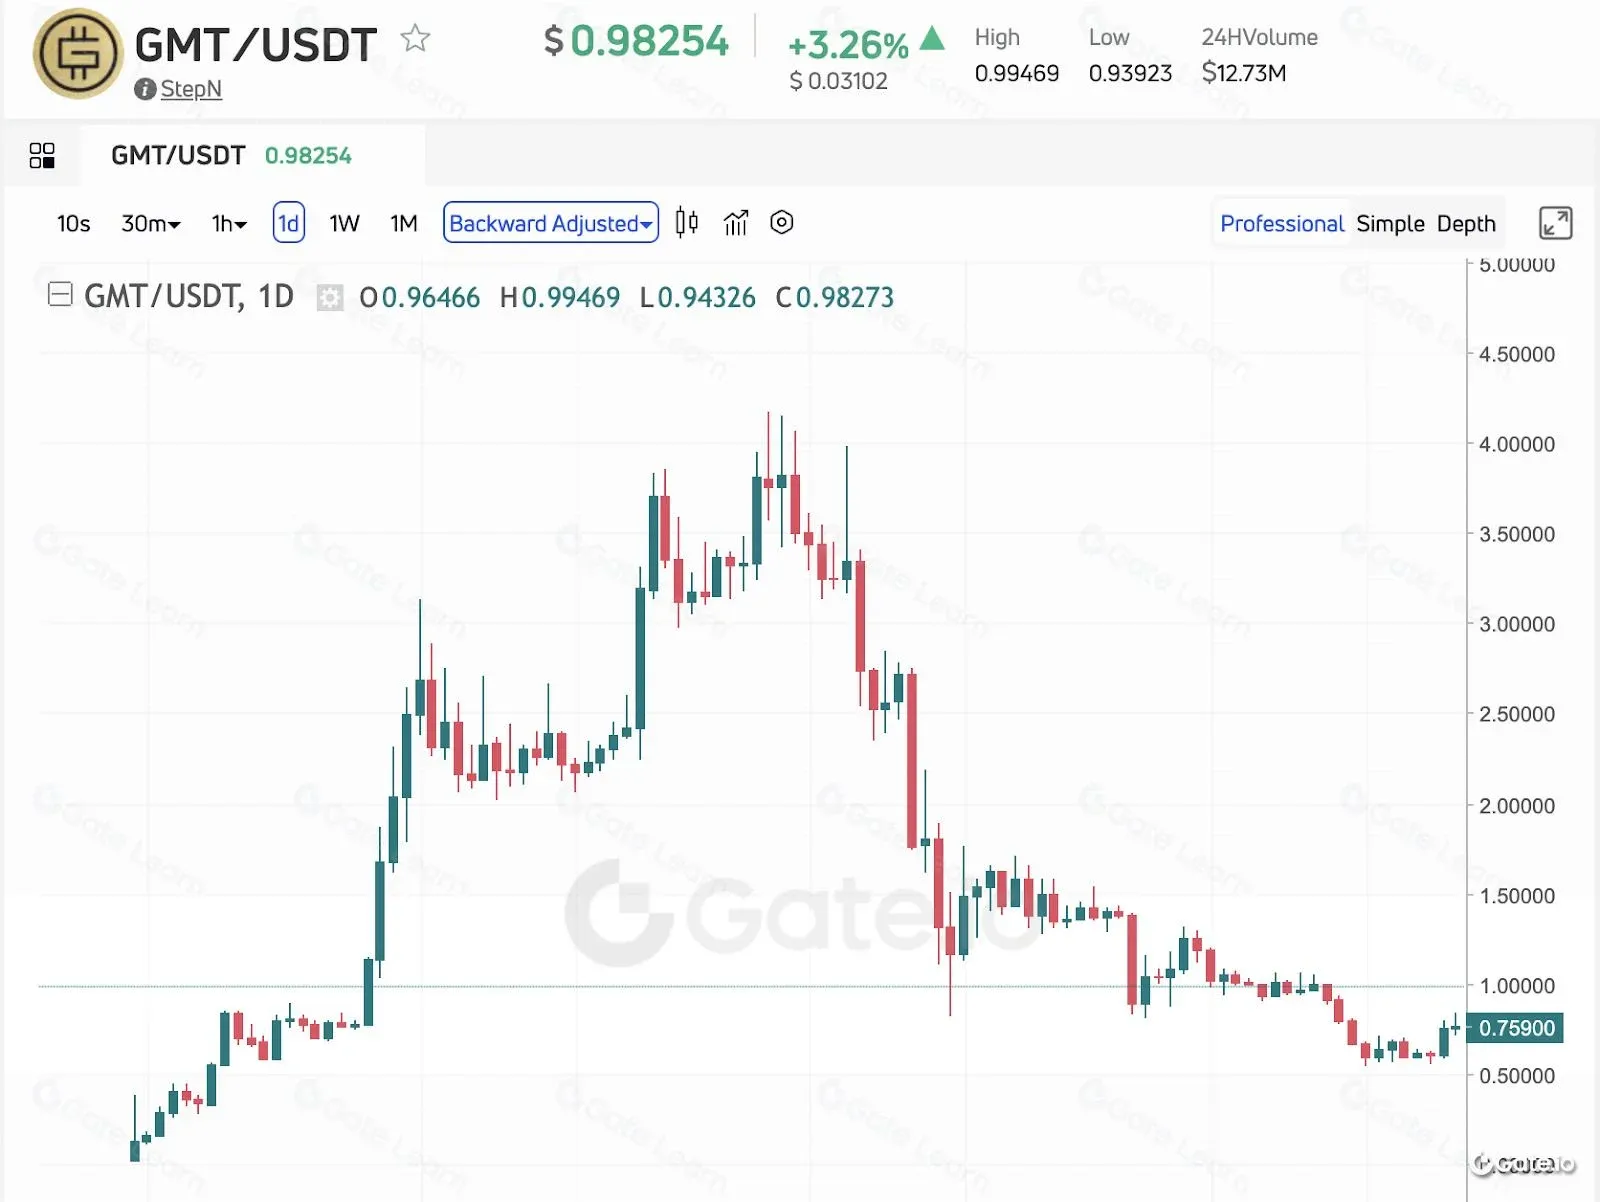
*By Gate.com*
Sample Fundamental‑Analysis Tools
Etherscan
Blockchain data is public and transparent. Etherscan, the Ethereum block explorer, lets you view transaction flows, wallet addresses, and token‑holder distribution. For instance, searching for SHIB reveals holder concentration, wallet addresses, and total supply.
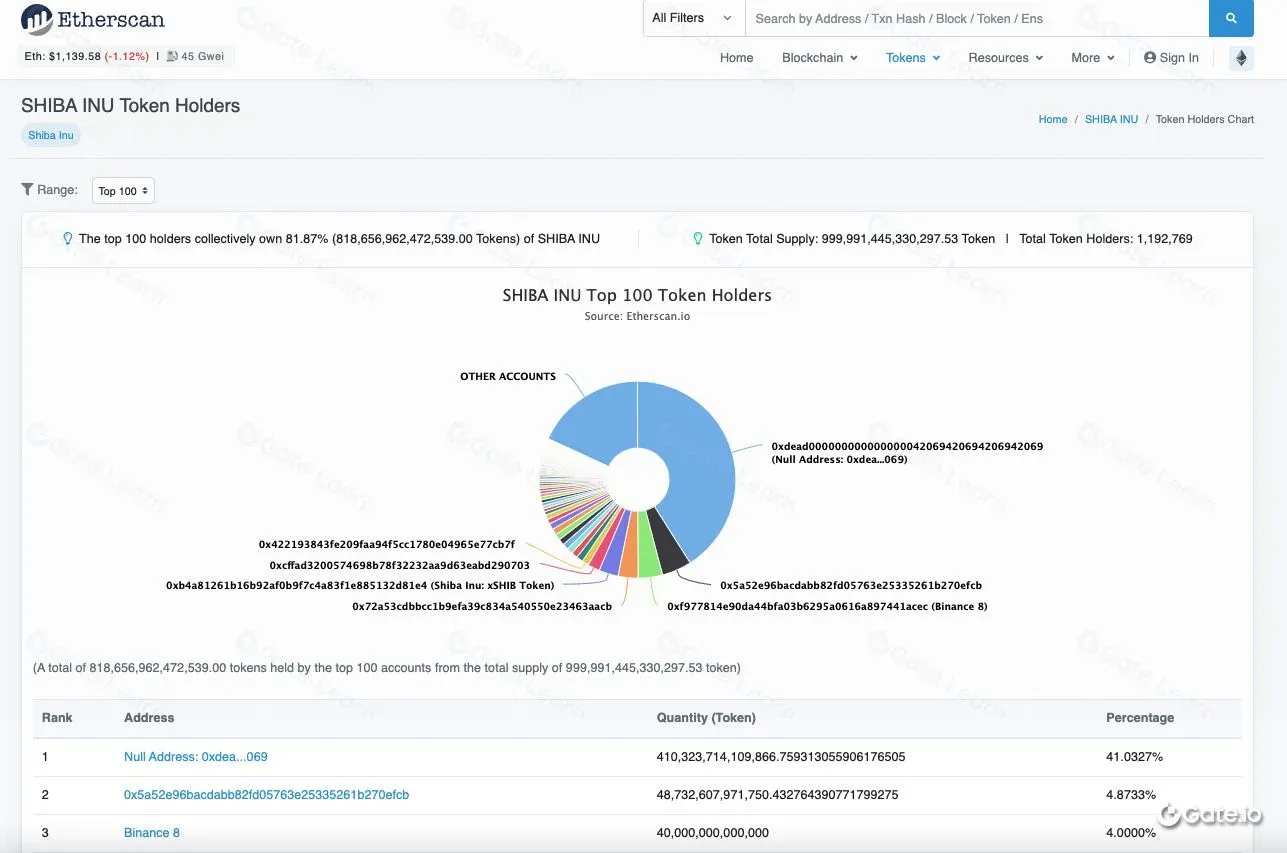
*By Etherscan*
Token Terminal
Token Terminal standardises traditional‑finance metrics for crypto projects, offering data on total market cap, circulating market cap, price‑to‑sales, price‑to‑earnings, token trading volume, TVL, revenue, and more. It also supports raw‑data downloads and multi‑filter queries, facilitating cross‑project comparisons.
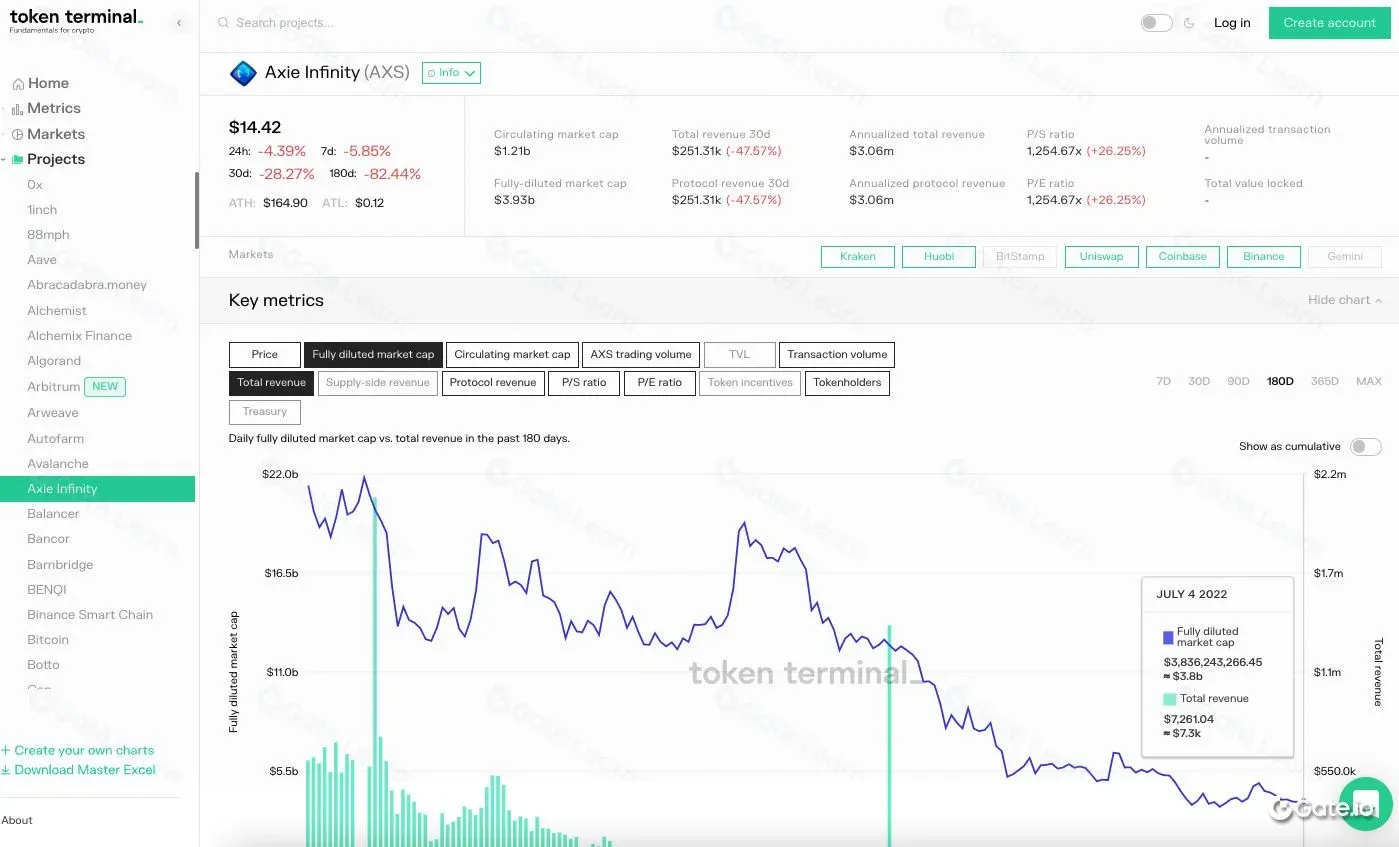
*By token terminal*
Dune Analytics
Dune is a free, powerful blockchain‑analysis platform. Users can write SQL queries against Ethereum data or use community‑crafted scripts to generate visualisations quickly. For example, one can query STEPN’s daily new users alongside price movement.
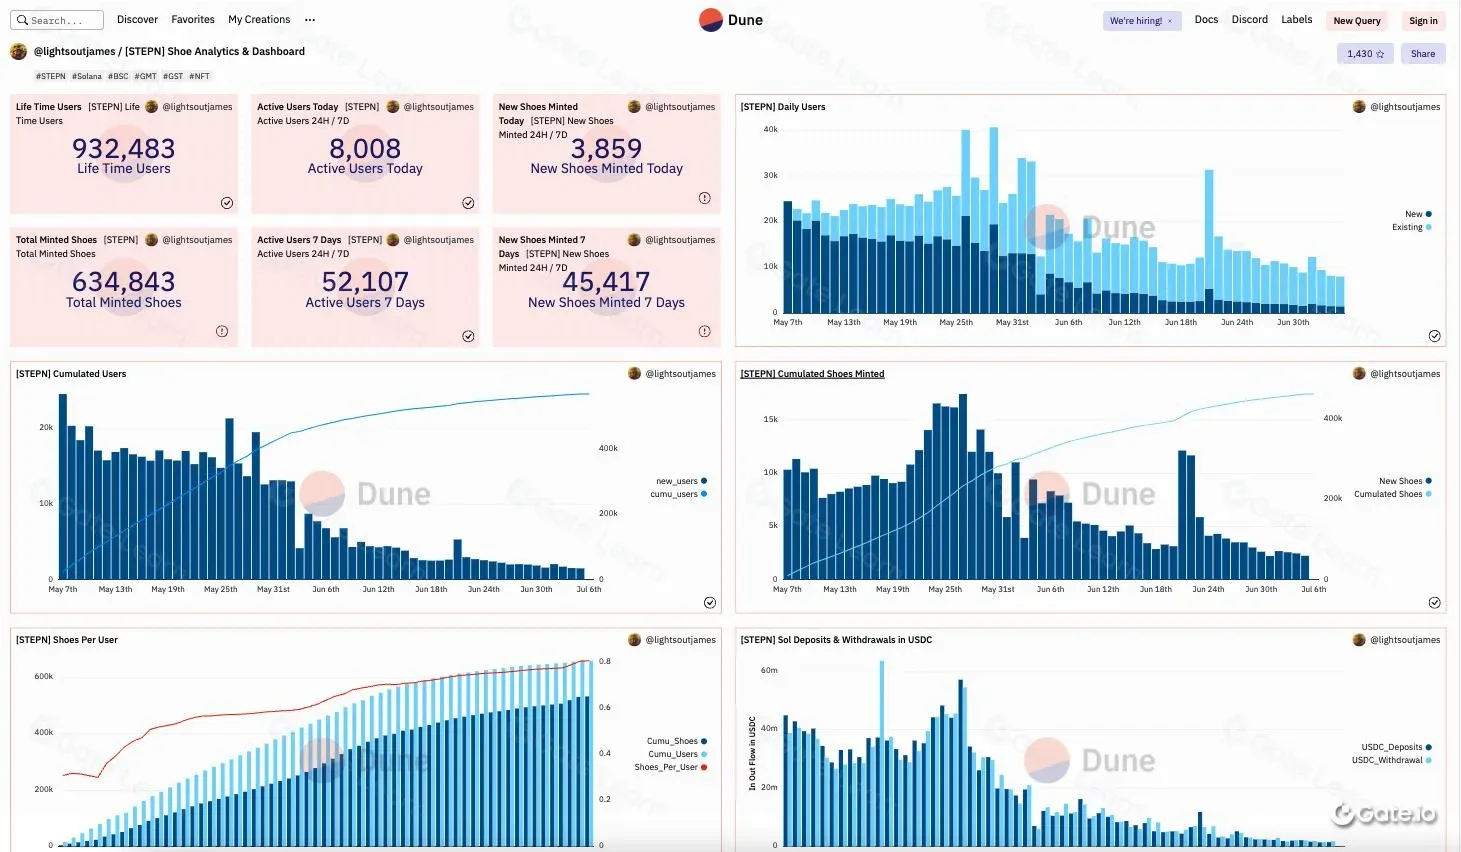
*By Dune*
Market News
Macro‑Economic Factors
Broad‑scale economic events influence crypto price action, including major protocol upgrades, exchange listings, and smart‑contract exploits. Bitcoin’s four‑year halving cycle remains the most pivotal cyclical event in the crypto world; each halving is typically followed by a new bullish phase.
Bitcoin Halving Timeline
- Launch: 2009‑01‑03 – Block reward 50 BTC
- 1st Halving: 2012‑11‑28 – Block reward 25 BTC
- 2nd Halving: 2016‑07‑09 – Block reward 12.5 BTC
- 3rd Halving: 2020‑05‑12 – Block reward 6.25 BTC
- 4th Halving: Expected 2024 – Block reward 3.125 BTC
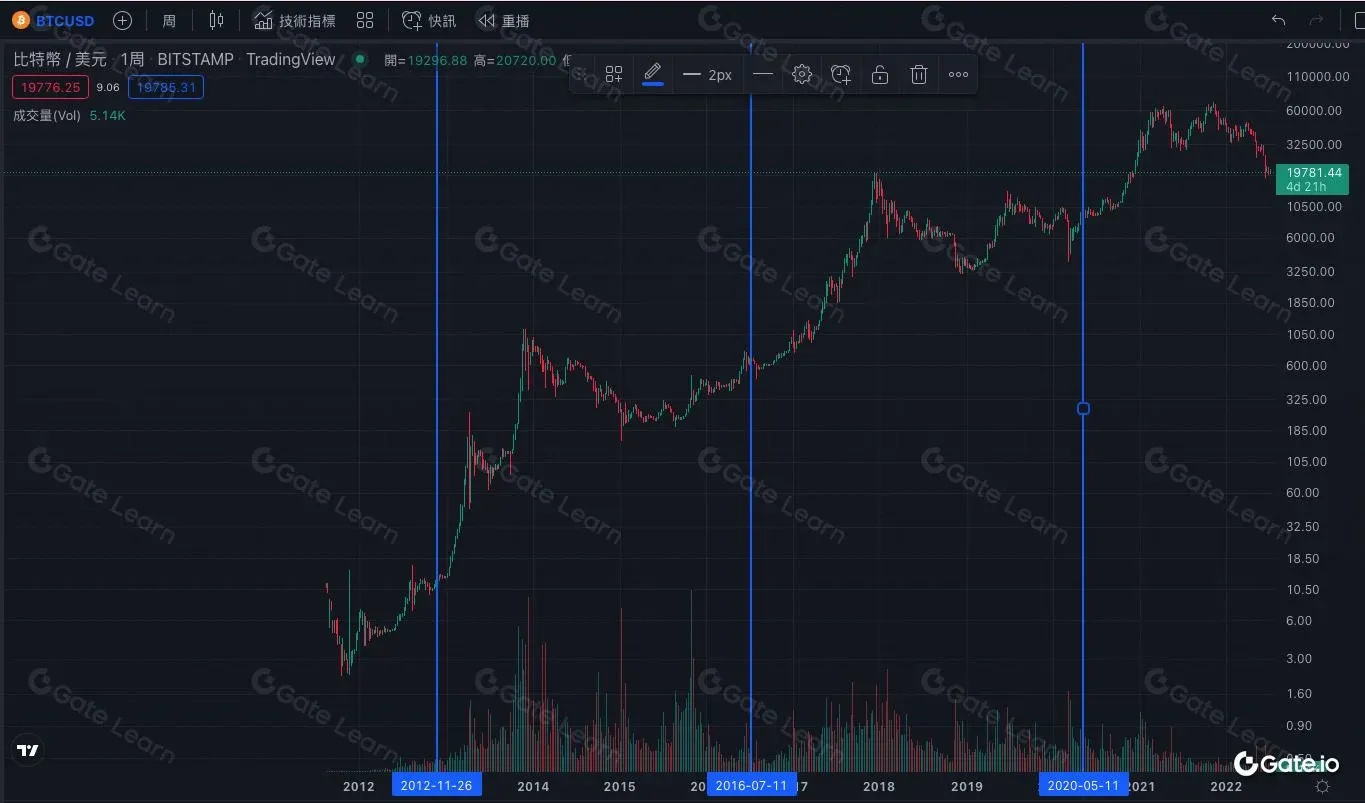
*By Trading View*
Exchange Spot‑Inventory Levels
During bull markets, large‑scale holders (“whales”) often move assets to cold wallets. In bear markets, to mitigate price‑drop risk, they may sell significant portions, causing exchange inventories to rise—a potential indicator of forthcoming selling pressure.
Whale‑Wallet Activity
Platforms such as Whale Alert monitor large‑wallet transfers in real time, helping observers spot substantial token flows. This information should be treated as a reference signal and not as a sole basis for investment decisions.

*By Whale Alert twitter*
Advantages and Disadvantages of Crypto Fundamental Analysis
Advantages
- Early detection of trend reversals
- Transparent capital flows; information is instantly accessible
- Helps filter suitable investment candidates
- Can reduce panic‑driven, irrational sell‑offs
Disadvantages
- Data can still be manipulated or fabricated
- No unified standardised reporting; information is fragmented
- Some data rely on project‑team disclosures, which may be incomplete or misleading
- Data collection and analysis can be time‑intensive
Conclusion
Cryptocurrencies constitute a nascent market where traditional‑finance fundamental‑analysis tools cannot be applied verbatim. Although blockchain’s openness ensures that information is traceable, analysts still need a suite of tools and platforms to aggregate and interpret the data. Current valuation models are imperfect and lack universal standards, leaving ample room for refinement. Investors who dig deep into a project’s fundamentals and build a more scientific analysis framework are better positioned to improve the odds of successful decision‑making.
Since 2020, new crypto projects have proliferated, and use‑cases have become increasingly diverse. The crypto space is highly volatile, offering both risk and opportunity. Developing a personalized fundamental‑analysis methodology can aid investors in navigating this high‑risk, high‑reward environment with greater confidence.
*Note: Crypto gains may be taxable in many jurisdictions; consult local tax regulations or a qualified professional for guidance.*
*For U.S. residents, trading on Binance must be done via Binance.US, which complies with local regulations, while users elsewhere may use the global Binance platform.*
This article concludes the full exposition of “What Is Fundamental Analysis? A Comprehensive Guide to Evaluating Cryptocurrency Value.” For more information, search for previous Bitaigen (比特根) articles or continue browsing the related posts below. Thank you for supporting Bitaigen!
💡 Register on Binance with referral code B2345 for the maximum trading fee discount. See Binance complete guide.


