
Dogecoin is expected to trade within a $0.08‑$0.16 range throughout 2026. In the short term, price movements are driven by market sentiment, while the long‑term outlook remains constrained by the token’s infinite supply structure.
In this article we trace Dogecoin’s price evolution from its inception to the present, combine on‑chain data with market sentiment, and conduct an in‑depth assessment of the likely 2026 price corridor. By analysing supply mechanisms, community activities and macro‑economic factors from multiple angles, we aim to help readers clarify the long‑term value trajectory. Subsequent sections will present detailed charts and trend analyses—please continue reading.
1. Origin of Dogecoin and Early Price Development
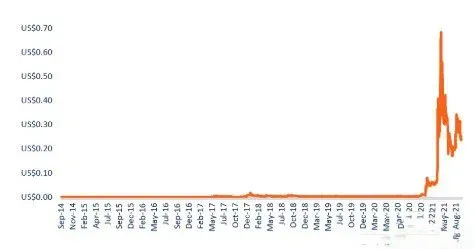
Dogecoin launched on December 6 2013, inspired by the then‑viral “Doge” meme. Unlike Bitcoin, it employs an unlimited supply model, adding roughly 5 billion coins per year, which kept its price at a very low level from day one.
- 2013 – In its first month the price was about $0.0002; by year‑end, community‑driven sponsorships such as the Jamaican bobsleigh team lifted it to $0.0005. According to Coinlore, the annual average was $0.000422, with a high of $0.00152 and a low of $0.000116, and market capitalisation was only about $5.9 million.
- 2014 – The broader crypto market entered a bear phase; the yearly average was $0.000461, the high $0.00234, the low $0.000103, and volatility reached 151 %. During this period Dogecoin was mainly used for small‑scale tipping and charitable donations.
- 2015 – The price fell to a historic low of $0.0000869 on May 6; the yearly average was $0.000143, influenced by global economic uncertainty and Bitcoin’s own price swings.
From 2016‑2018, Dogecoin’s price showed a slow recovery: an average of $0.000236 in 2016, a bullish‑driven rise to an average of $0.00323 in 2017 (peaking at $0.0184), and a retreat to $0.00264 during the 2018 bear market. This period displayed a clear cyclicality that mirrored Bitcoin’s halving cycles.
2. Detailed Year‑by‑Year Price Table
The table below aggregates the key price metrics for Dogecoin from 2013 through 2026, sourced from Cryptorank, Coinlore and Yahoo Finance (as of 28 Feb 2026).
| Year | Avg. Price (USD) | High (USD) | Low (USD) | YoY Change (%) | Avg. Market Cap (USD bn) |
|---|---|---|---|---|---|
| 2013 | 0.000422 | 0.001520 | 0.000116 | –0.05 | 0.059 |
| 2014 | 0.000461 | 0.002340 | 0.000103 | +9.2 | 0.065 |
| 2015 | 0.000143 | 0.000247 | 0.0000869 | –69 | 0.020 |
| 2016 | 0.000236 | 0.000500 | 0.000125 | +65 | 0.033 |
| 2017 | 0.003230 | 0.01840 | 0.000109 | +1268.6 | 0.453 |
| 2018 | 0.002640 | 0.01810 | 0.00159 | –18.3 | 0.370 |
| 2019 | 0.002390 | 0.004680 | 0.00159 | –9.5 | 0.335 |
| 2020 | 0.003580 | 0.01410 | 0.00123 | +49.8 | 0.502 |
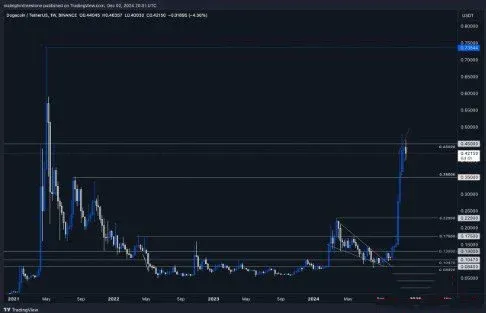
| 2021 | 0.1920 | 0.7370 | 0.00465 | +5264 | 26.92 |
| 2022 | 0.0865 | 0.1780 | 0.0492 | –54.9 | 12.12 |
| 2023 | 0.0772 | 0.2050 | 0.0574 | –10.8 | 10.82 |
| 2024 | 0.1120 | 0.2280 | 0.0601 | +45.1 | 15.72 |
| 2025 | 0.0984 | 0.1560 | 0.0712 | –12.1 | 13.82 |
| 2026 | 0.0934 | 0.1557 | 0.0813 | –5.1 | 13.1 |
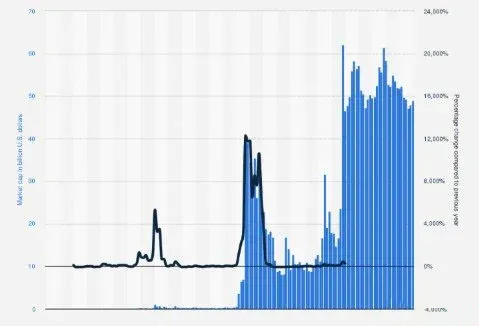
The table shows that from 2013‑2020 Dogecoin consistently hovered between $0.0001‑$0.01, delivering modest gains. The spectacular 2021 surge—fuelled by Elon Musk’s tweets and a Reddit‑driven meme wave—produced a 5,264 % annual increase, pushing the average price to $0.192 and market cap to roughly $2.7 billion. Subsequent bear markets in 2022‑2023 halved the price, while 2024 saw a modest rebound and 2025‑2026 settled into a range‑bound pattern.
3. Analysis of Historical Price Charts
Dogecoin’s price trajectory can be split into three distinct phases:
- Incubation Phase (2013‑2017)
- The curve is relatively flat, with only minor fluctuations.
- During the 2017 bull run, the price climbed from roughly $0.0002 to break the $0.01 mark by year‑end, creating the first noticeable peak.
- Explosion Phase (2018‑2021)
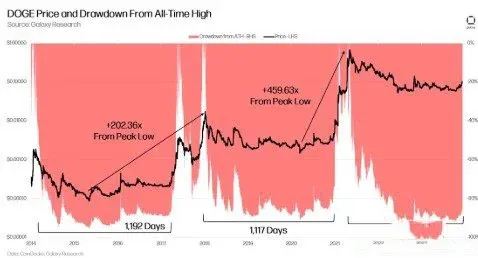
- In early January 2021, a Musk tweet triggered a jump from $0.004 to $0.032 (up 339 %).
- By May 2021 the token hit an all‑time high of $0.737, pushing market capitalisation past $90 billion.
- Adjustment Phase (2022‑2026)
- Prices retreated more than 90 % from the peak, bottoming at $0.0492 in 2022.
- A modest rebound in 2023 lifted the price to $0.205 before the market entered a consolidation period.
- The 2024 Bitcoin halving spurred a rise to $0.228, after which 2025‑2026 saw oscillations within the $0.07‑$0.16 band.
Technical Highlights
- Fibonacci retracements & Moving Averages (MA): The long‑term 200‑day MA sits around $0.115; the current price is below this level, suggesting that the bear market may still be in effect.
- RSI: As of February 2026, the Relative Strength Index entered the oversold zone (<30), potentially hinting at a short‑term bounce.
- Volume: Daily transaction volume topped $2 billion during the bull market, but fell below $500 million in the bear phase.
Market‑cap dynamics mirror price movements: from $5.9 million in 2013, peaking at roughly $90 billion in 2021, and settling around $13.1 billion in 2026. The unlimited supply introduces a noticeable dilution effect on valuation.
4. Key Drivers Behind Dogecoin’s Price
- Celebrity Effect
- Since 2019, Elon Musk’s occasional endorsements on X (formerly Twitter) have repeatedly sparked short‑term spikes. On April 2021, his “Dogecoin to the moon” tweet lifted the price by roughly 50 % on the same day.
- Community & Social Media
- The r/dogecoin subreddit exceeds 2 million active members; meme culture continuously supplies liquidity and public attention.
- Macro Environment
- Overall crypto cycles, Bitcoin price trends, and regulatory developments heavily influence Dogecoin. The easy‑money environment of 2021 propelled the bull market, while the 2022 Federal Reserve rate hikes triggered a sharp correction.
- Technology & Adoption
- Low transaction fees and fast confirmation times are Dogecoin’s core competitive edges. Rumours of an X‑payment integration in 2025 could improve real‑world utility and provide a short‑term price lift.
- Competitive Landscape
- Meme‑coins such as Shiba Inu siphon some capital, yet Dogecoin retains a brand advantage and a more entrenched community, keeping it ahead of many peers.
5. 2026 Outlook and Beyond
Based on historical patterns and the current technical picture, Dogecoin is projected to trade within a $0.08‑$0.16 corridor throughout 2026. Should the X‑payment feature go live, a breakout above $0.20 is conceivable.
- Long‑Term Challenge: The infinite supply model adds 5 billion new coins each year, creating a dilution pressure that limits upward price potential.
- Potential Upside: If the community successfully proposes and implements supply‑adjustment mechanisms or upgrades on‑chain functionality, investor confidence could be bolstered.
Some forecasting models suggest that, if market sentiment stays aligned with Bitcoin, the average price could reach around $0.50 by 2030, albeit with heightened volatility and regulatory uncertainty.
6. Conclusion: Lessons from Dogecoin’s Price History
Dogecoin’s historical price chart and year‑by‑year data reveal the “double‑edged sword” nature of meme‑coins: a passionate community can propel prices sharply in the short run, but structural supply characteristics and macro‑level risks cap long‑term appreciation. Investors should keep an eye on market sentiment, technical indicators, and any prospective supply‑governance changes, while maintaining diversified risk exposure. Whether or not Dogecoin surpasses its previous peaks again, it has already etched an unforgettable chapter in cryptocurrency history.
For deeper analysis of Dogecoin price movements, stay tuned to Bitaigen’s (比特根) upcoming专题文章.
Note for U.S. readers: When purchasing Dogecoin on a centralized exchange, use Binance.US rather than the global Binance platform to remain compliant with local regulations.
Tax reminder: Crypto gains may be subject to taxation in your jurisdiction; consult a qualified tax professional to understand your obligations.
Related Reading
- SUI Token 2026 Price Forecast: Trend Analysis & Investment Outlook
- Solana (SOL) Technical Review & Price Forecast 2026‑2030
- BONK Token Price Forecast 2026‑2030: In‑Depth Analysis & Outlook
💡 Register on Binance with referral code B2345 for the maximum trading fee discount. See Binance complete guide.
⚠️ Risk Disclaimer: Crypto prices are highly volatile. This is not investment advice.


