

Analysts are watching the $2 level because, during the 2026‑2030 cycle expansion, $2 could become a key psychological resistance and a potential upside target for Dogecoin.
This article examines market structure, sentiment, and technical patterns to dissect the pivotal psychological thresholds Dogecoin may encounter over the next several years, explaining why analysts view $2 as a plausible upside goal. By combining historical price action with on‑chain data, we provide a panoramic view to help readers gauge future positioning.
Dogecoin’s market structure is gradually taking shape, and the market is calming
The Dogecoin price outlook for 2026 is slowly shifting away from what once looked like random fluctuations.
Traders may still recall the quiet market before the early‑2021 rally; at that time the monthly chart showed only a modest pull‑back while overall stability remained.
Currently Dogecoin trades around $0.12, with thin volume and muted sentiment, and the price range is tightening rather than collapsing.
Although this phase is unremarkable, it could represent a positioning period before the next wave of attention.
Dogecoin price action shows demand under pressure
On the 4‑hour chart, price is tracking along an upward trend line that previously acted as support.
The last bounce from this level sparked a strong rally, and traders are still watching it closely.
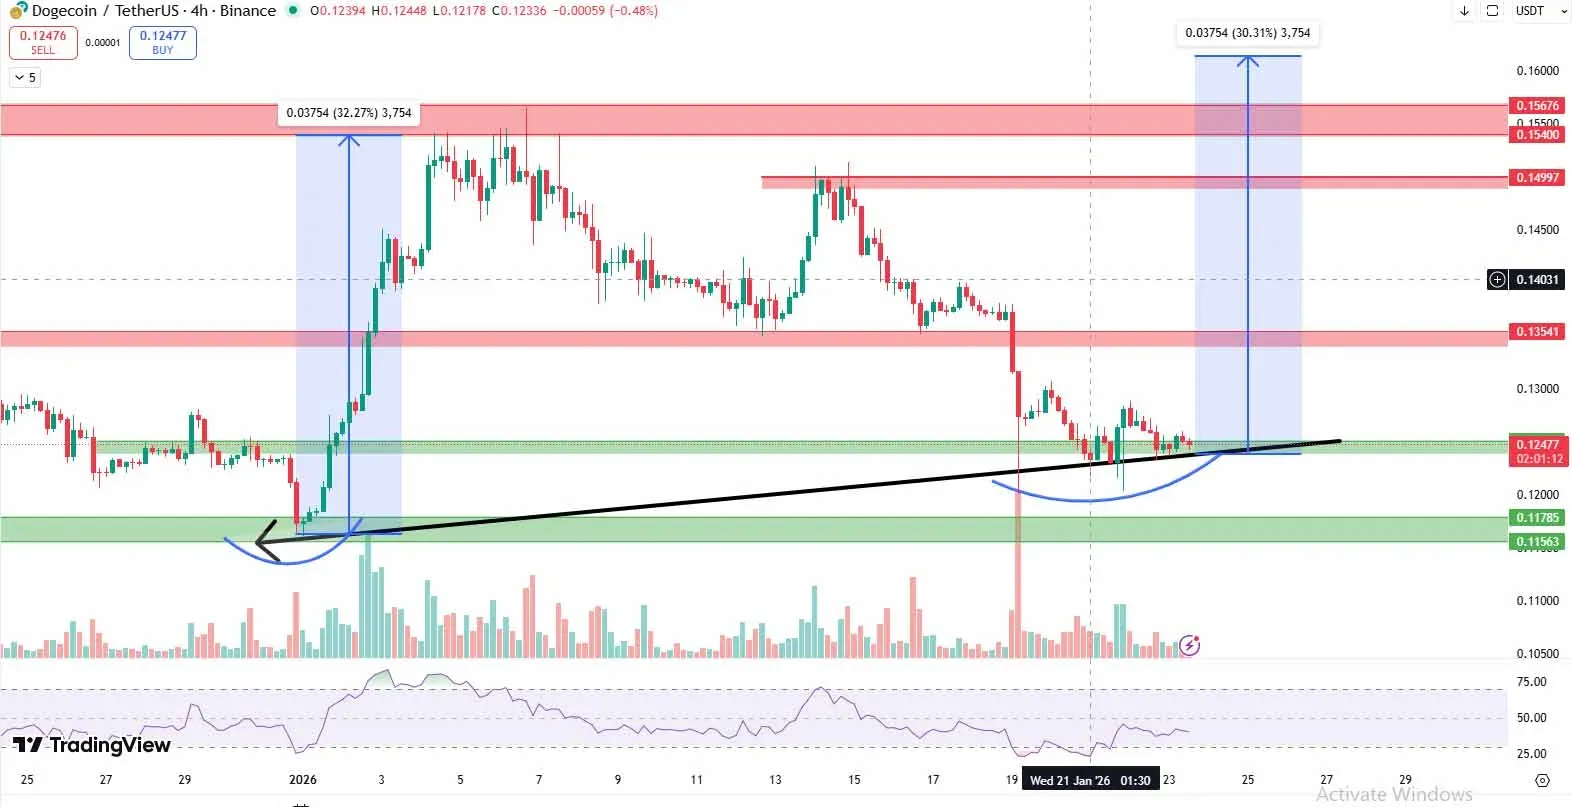
At present price has slipped to the vicinity of $0.12500 and is being tested at the same support. The structure remains intact; if the short‑term trend continues to rebound, the picture stays the same. If the trend line is broken, market focus will shift downward.
Key levels
- Support zone: $0.12500 (support from the upward trend line)
- Down‑side risk: $0.11800‑$0.11500 (demand zone that opens if the trend line is breached)
- Immediate resistance: $0.13500 (first signal for buyers to re‑enter)
- Continuation upside: $0.15000‑$0.15600 (momentum turns bullish after a breakout)
As long as the support holds, upside room remains; a break would accelerate a downtrend.
Dogecoin’s daily chart still oscillates within a range
CoinGape Media recently noted that Dogecoin continues to move within a relatively wide intraday range, with the chart staying stable and not being swayed by sentiment.
On the daily chart, Dogecoin is confined inside a descending channel. Prices have bounced in the $0.11500‑$0.11800 demand zone, but momentum remains weak, supply pressure is increasing, and the price is extending toward the $0.18000‑$0.20000 area— the primary upside target on the daily timeframe.
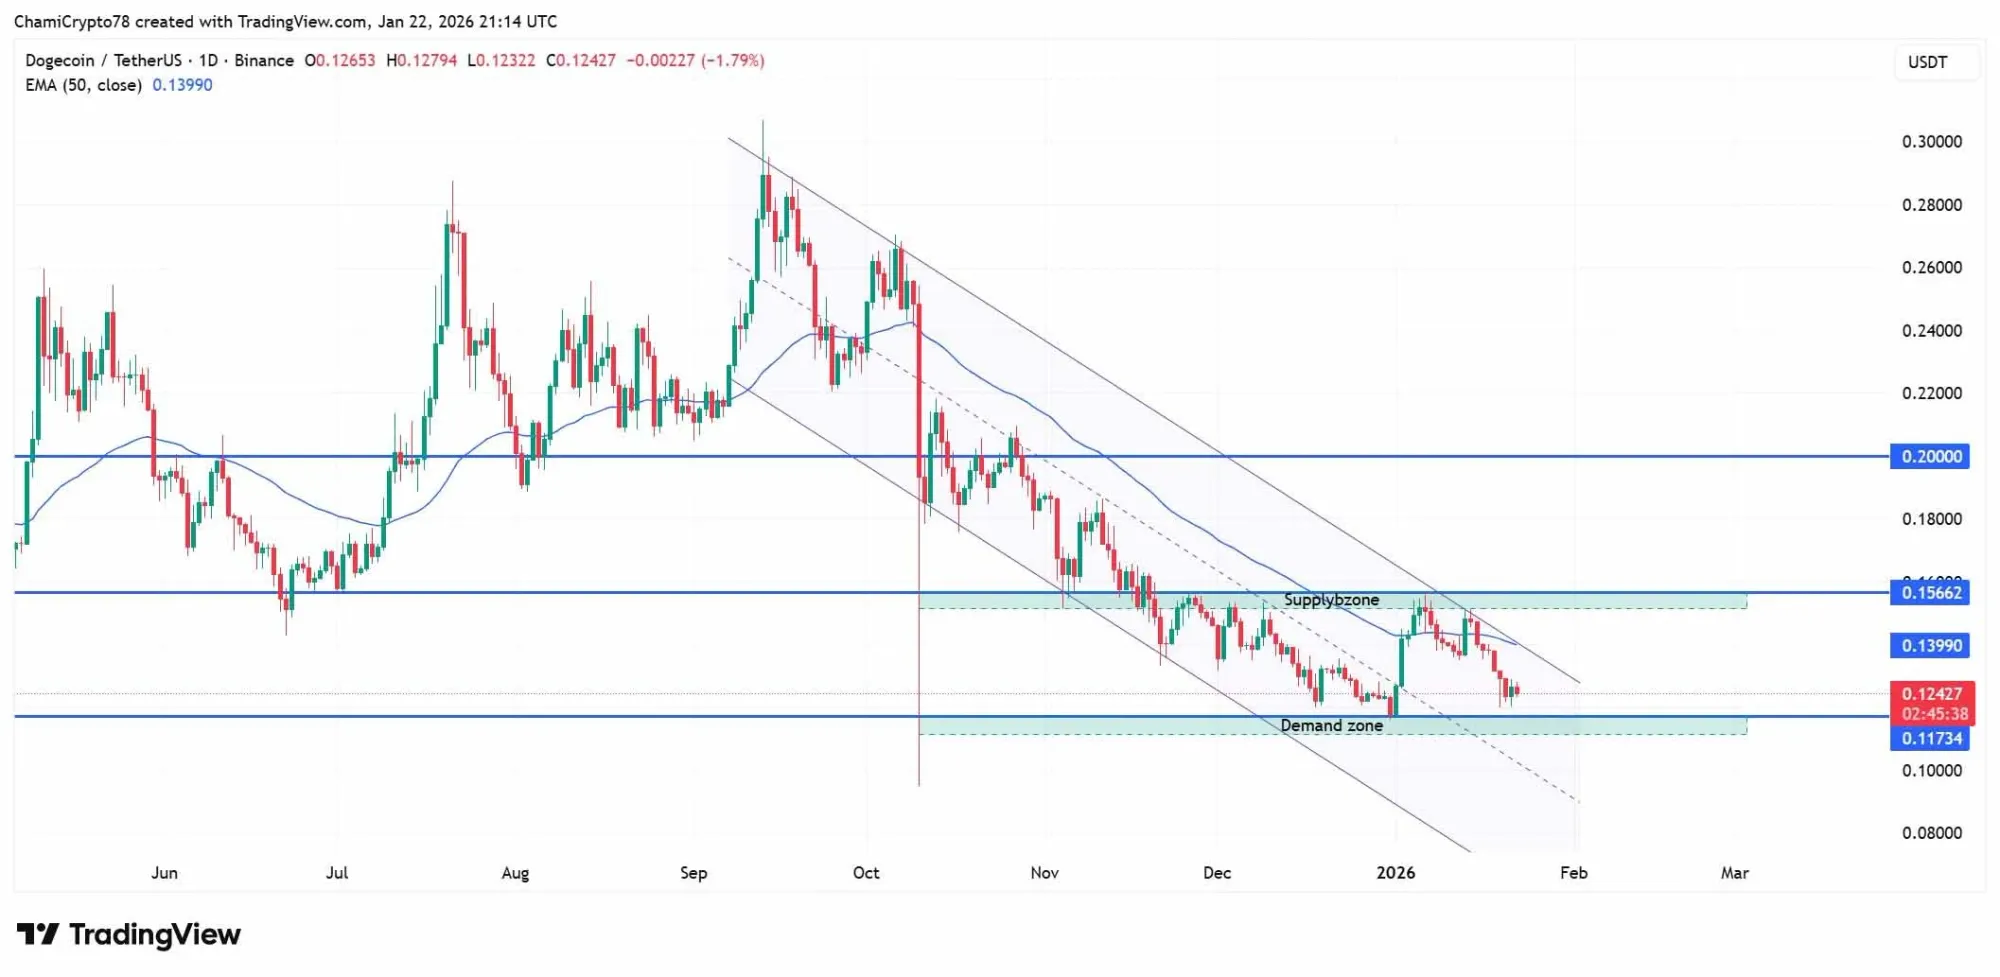
If the $0.11500 demand zone is broken, the daily pattern would invalidate and the trend would turn downwards. The current market looks more like a digestion phase rather than a trend reversal.
Dogecoin’s 3‑day structure shows a familiar pattern
Alan Tat points out that Dogecoin is undergoing a structural compression on a higher‑timeframe. Such periods are rarely about short‑term volatility; they are usually preparatory adjustments for a larger‑cycle expansion.
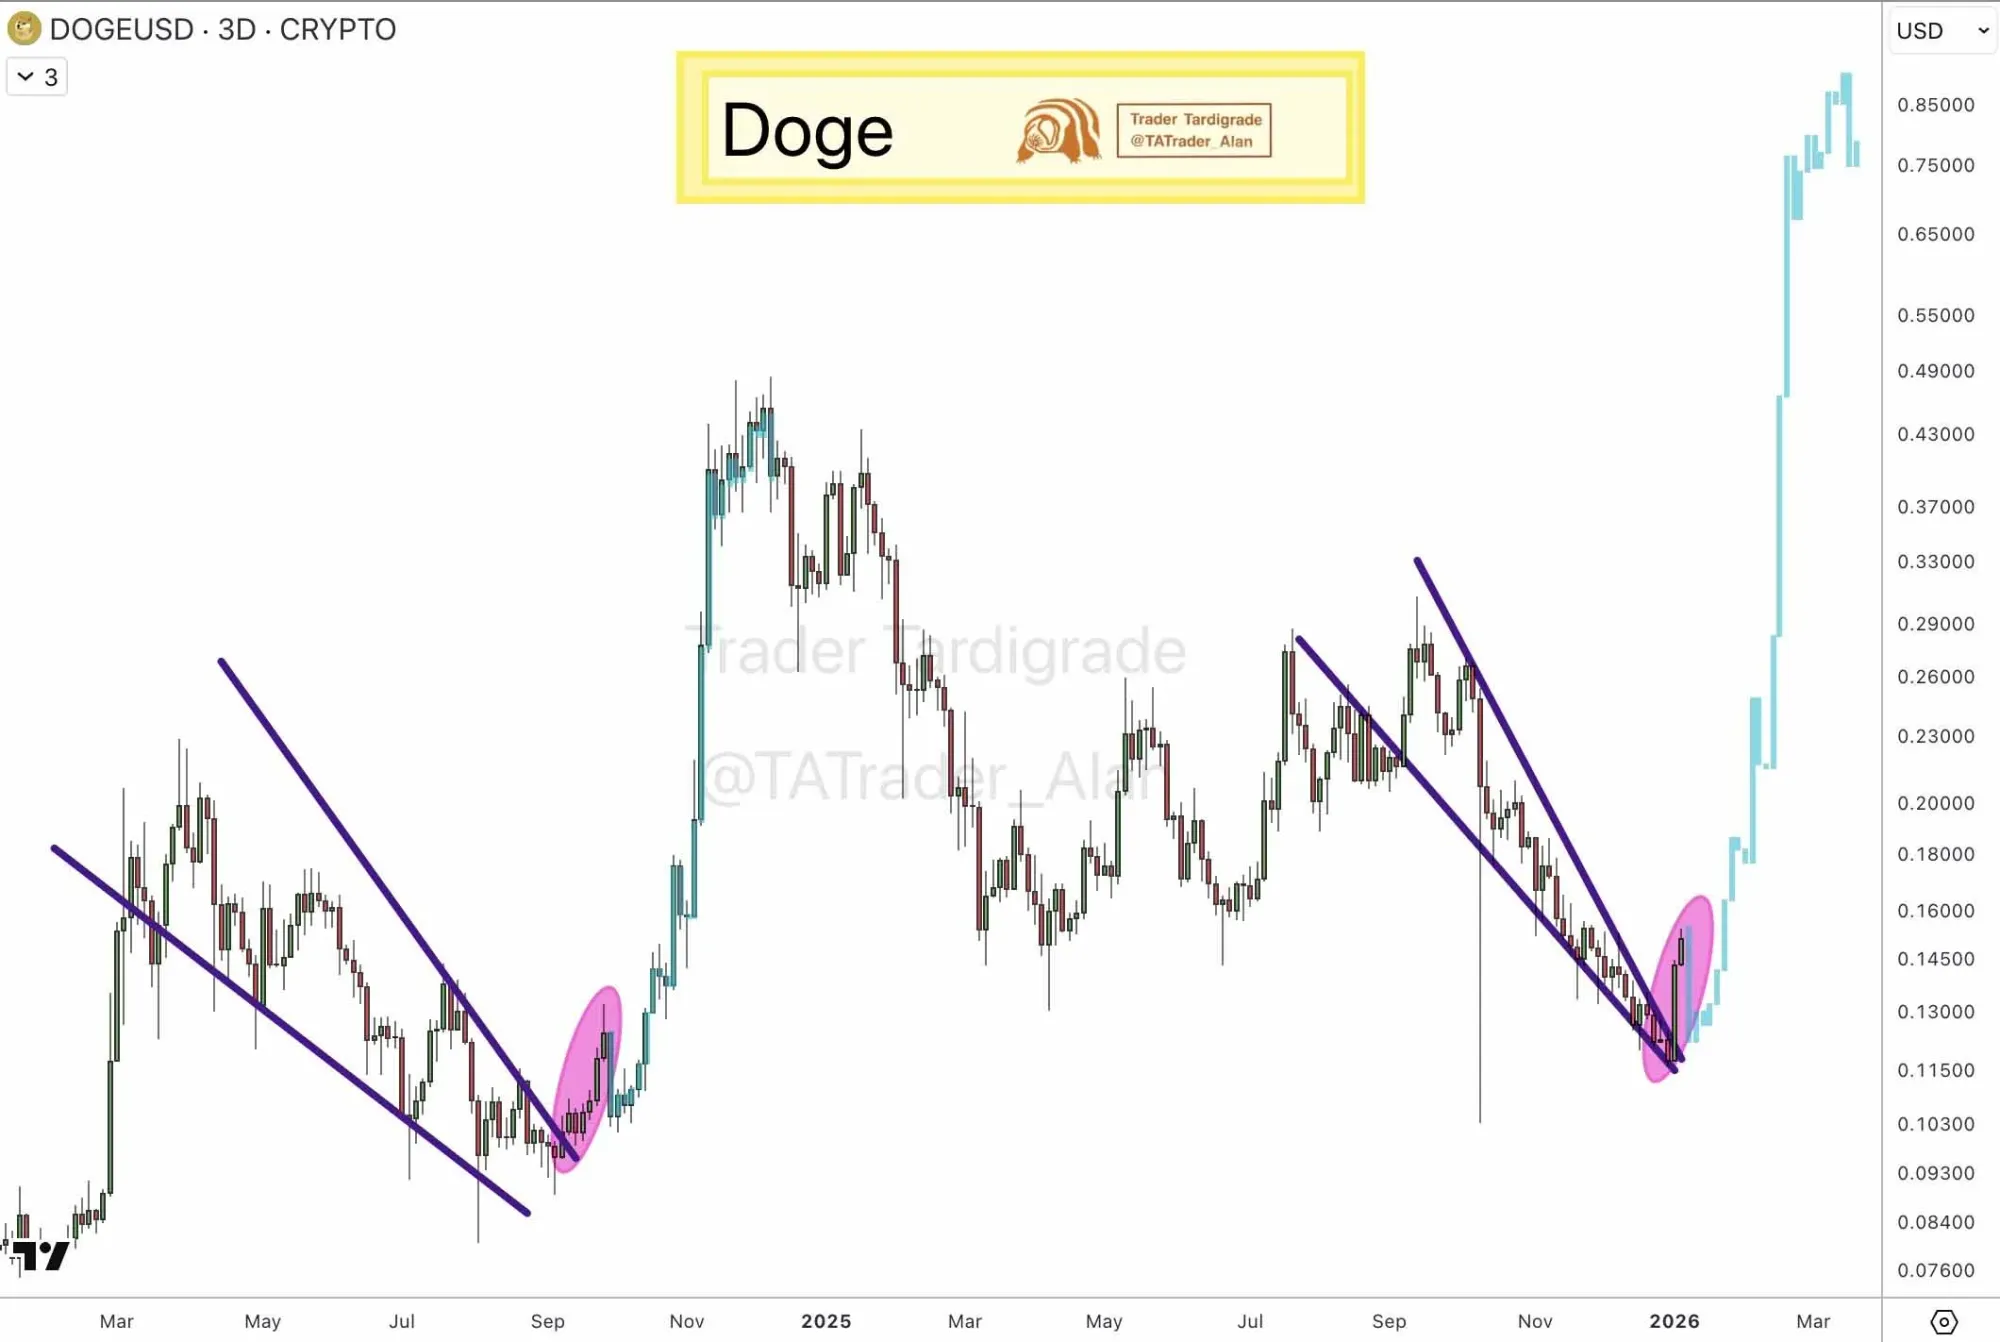
The current higher‑order structure is compressed rather than exhausted, a behavior historically seen during long‑window phases rather than during brief corrective moves.
Dogecoin’s weekly structure remains stable
Ali Martínez notes that Dogecoin on the weekly chart is in a familiar consolidation phase. After a sharp rally, the asset often spends an extended period moving sideways within a descending structure.
During this phase volatility has not eased; instead it has narrowed slightly, with price stabilizing in the $0.12‑$0.13 band and forming weekly support.
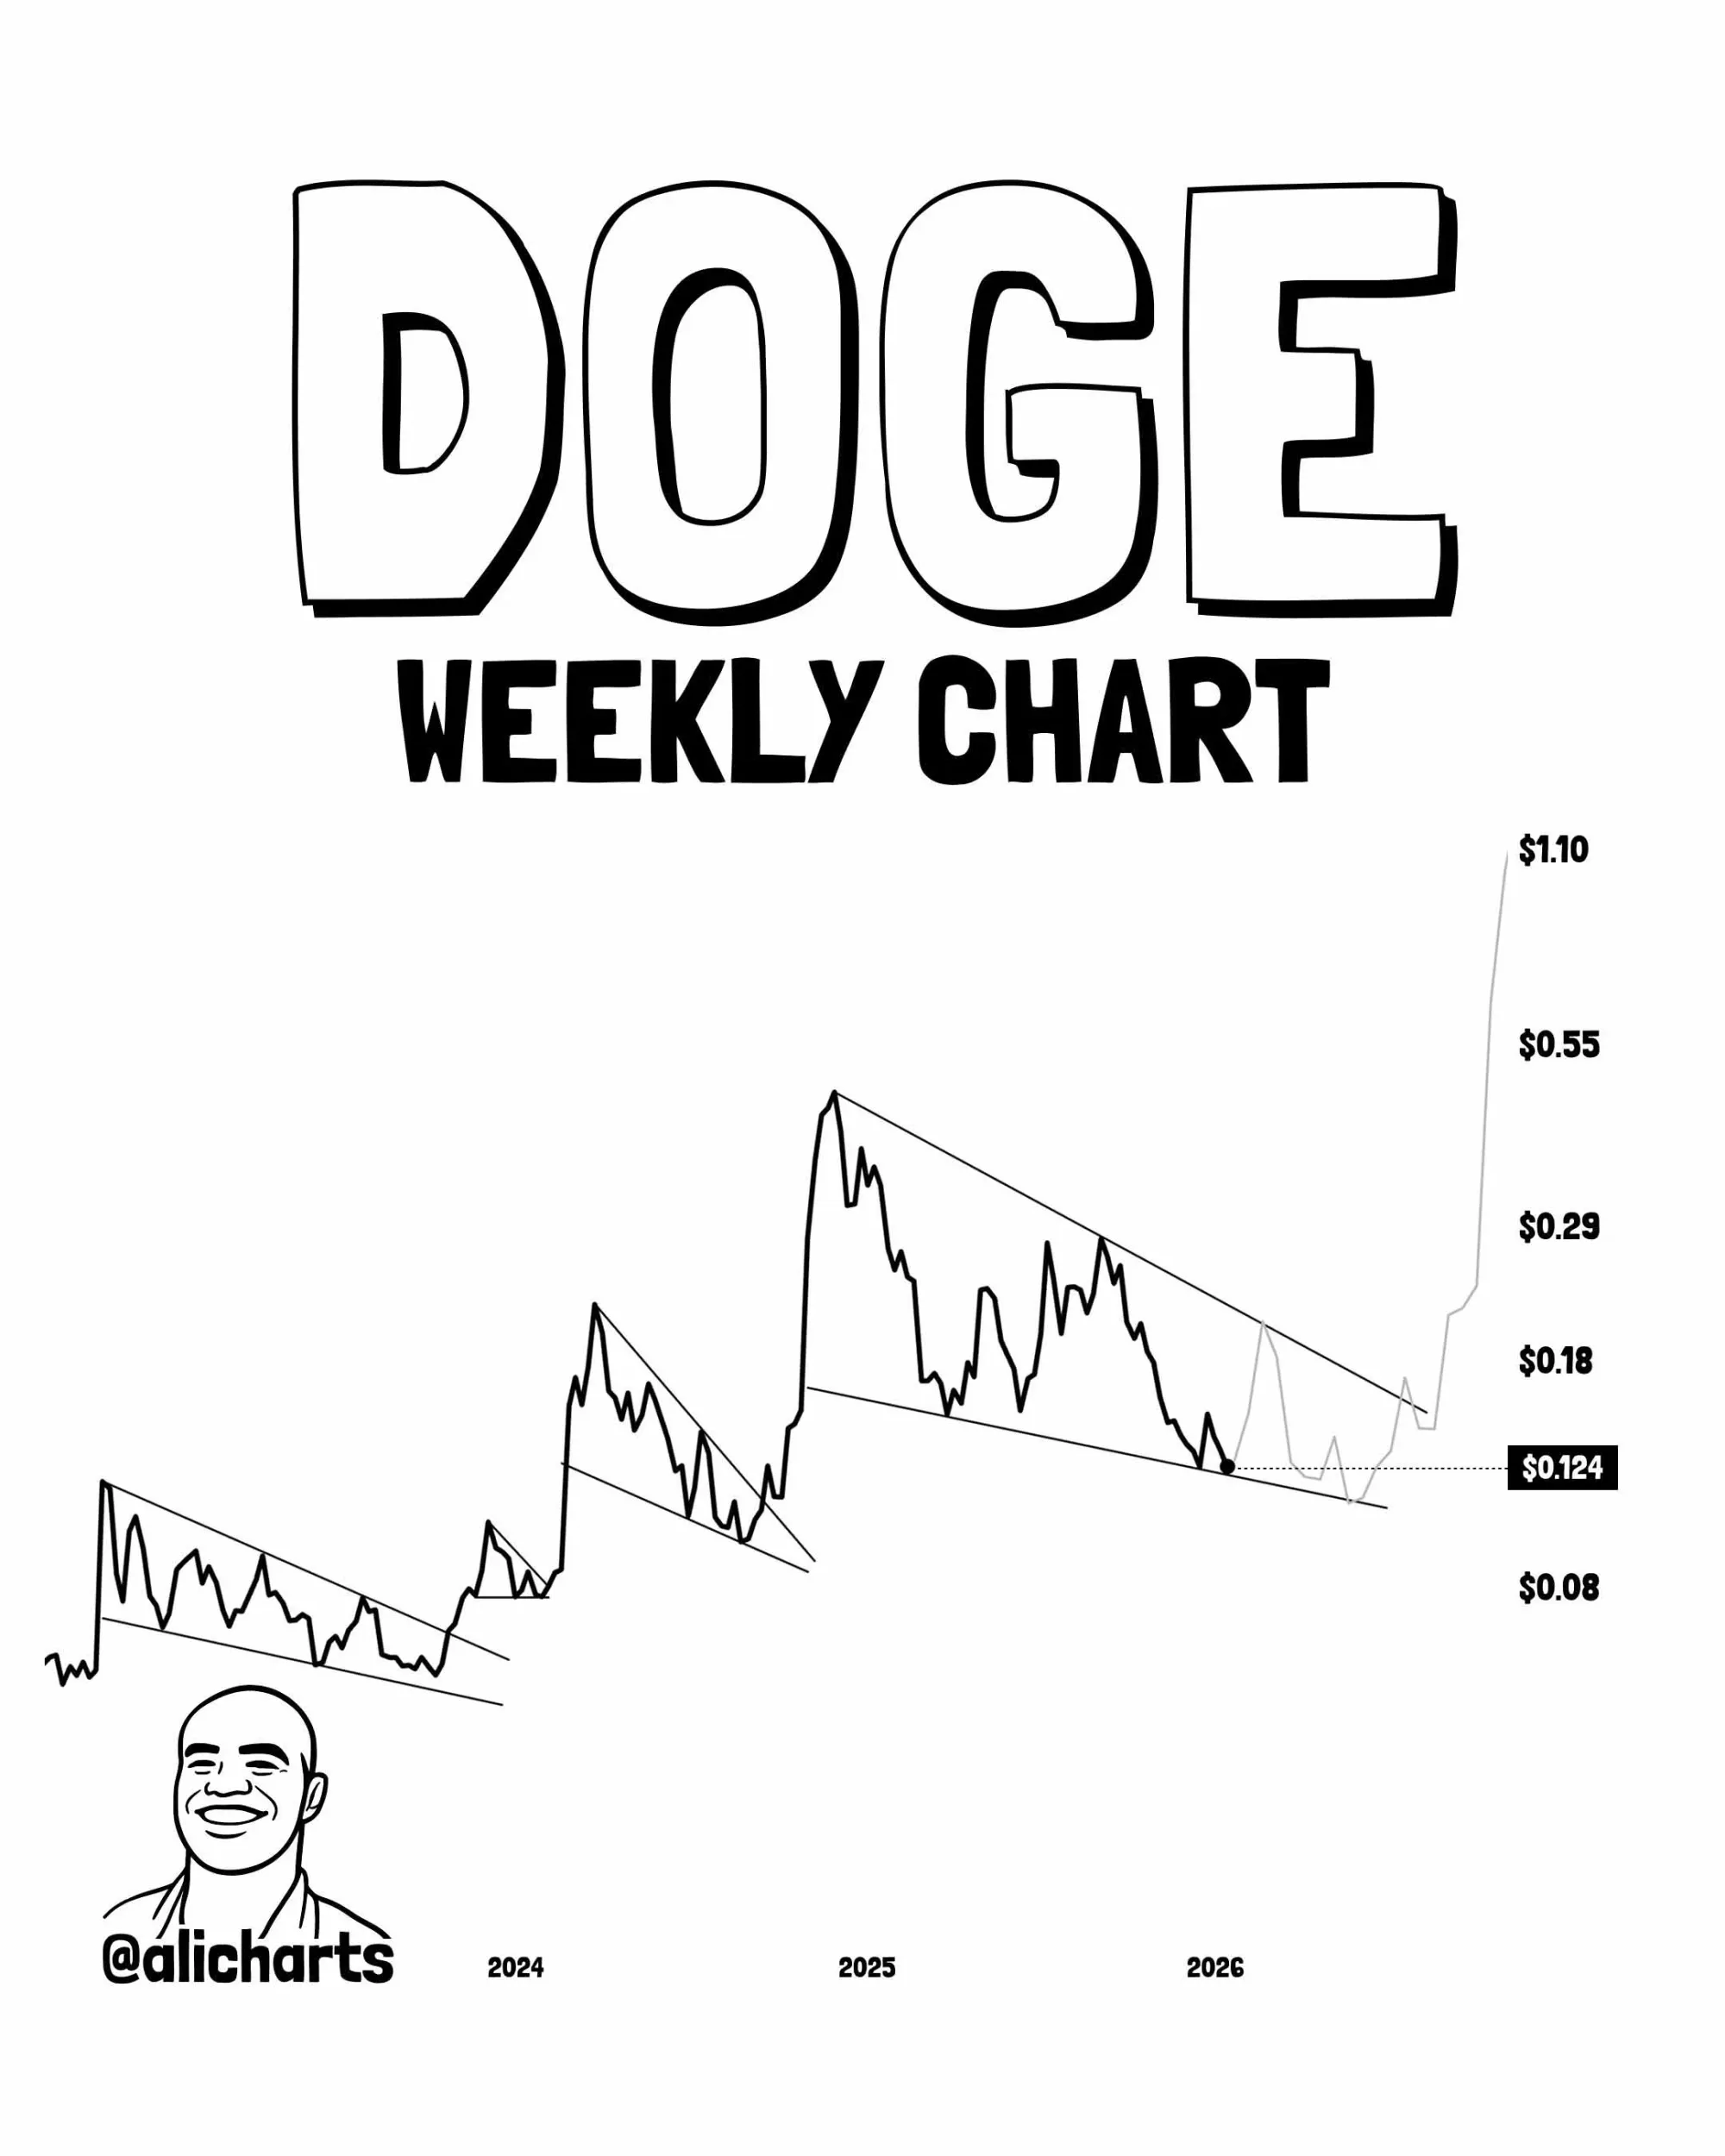
From an upside perspective, resistance levels appear sequentially at $0.18, $0.29, $0.55 and the psychological barrier of $1.10— each of which has capped price advances in previous cycles. On the weekly horizon, this behavior typically reflects a digestion process rather than weakness.
Dogecoin’s monthly price action maintains the larger framework
Alan Tat emphasizes that Dogecoin on the monthly chart still follows a long‑term upward trend line that spans several cycles. Every major expansion has historically been triggered after price compression along this structure.
The current pull‑back sits just above the $0.10‑$0.12 support band, a zone that has repeatedly acted as a floor.
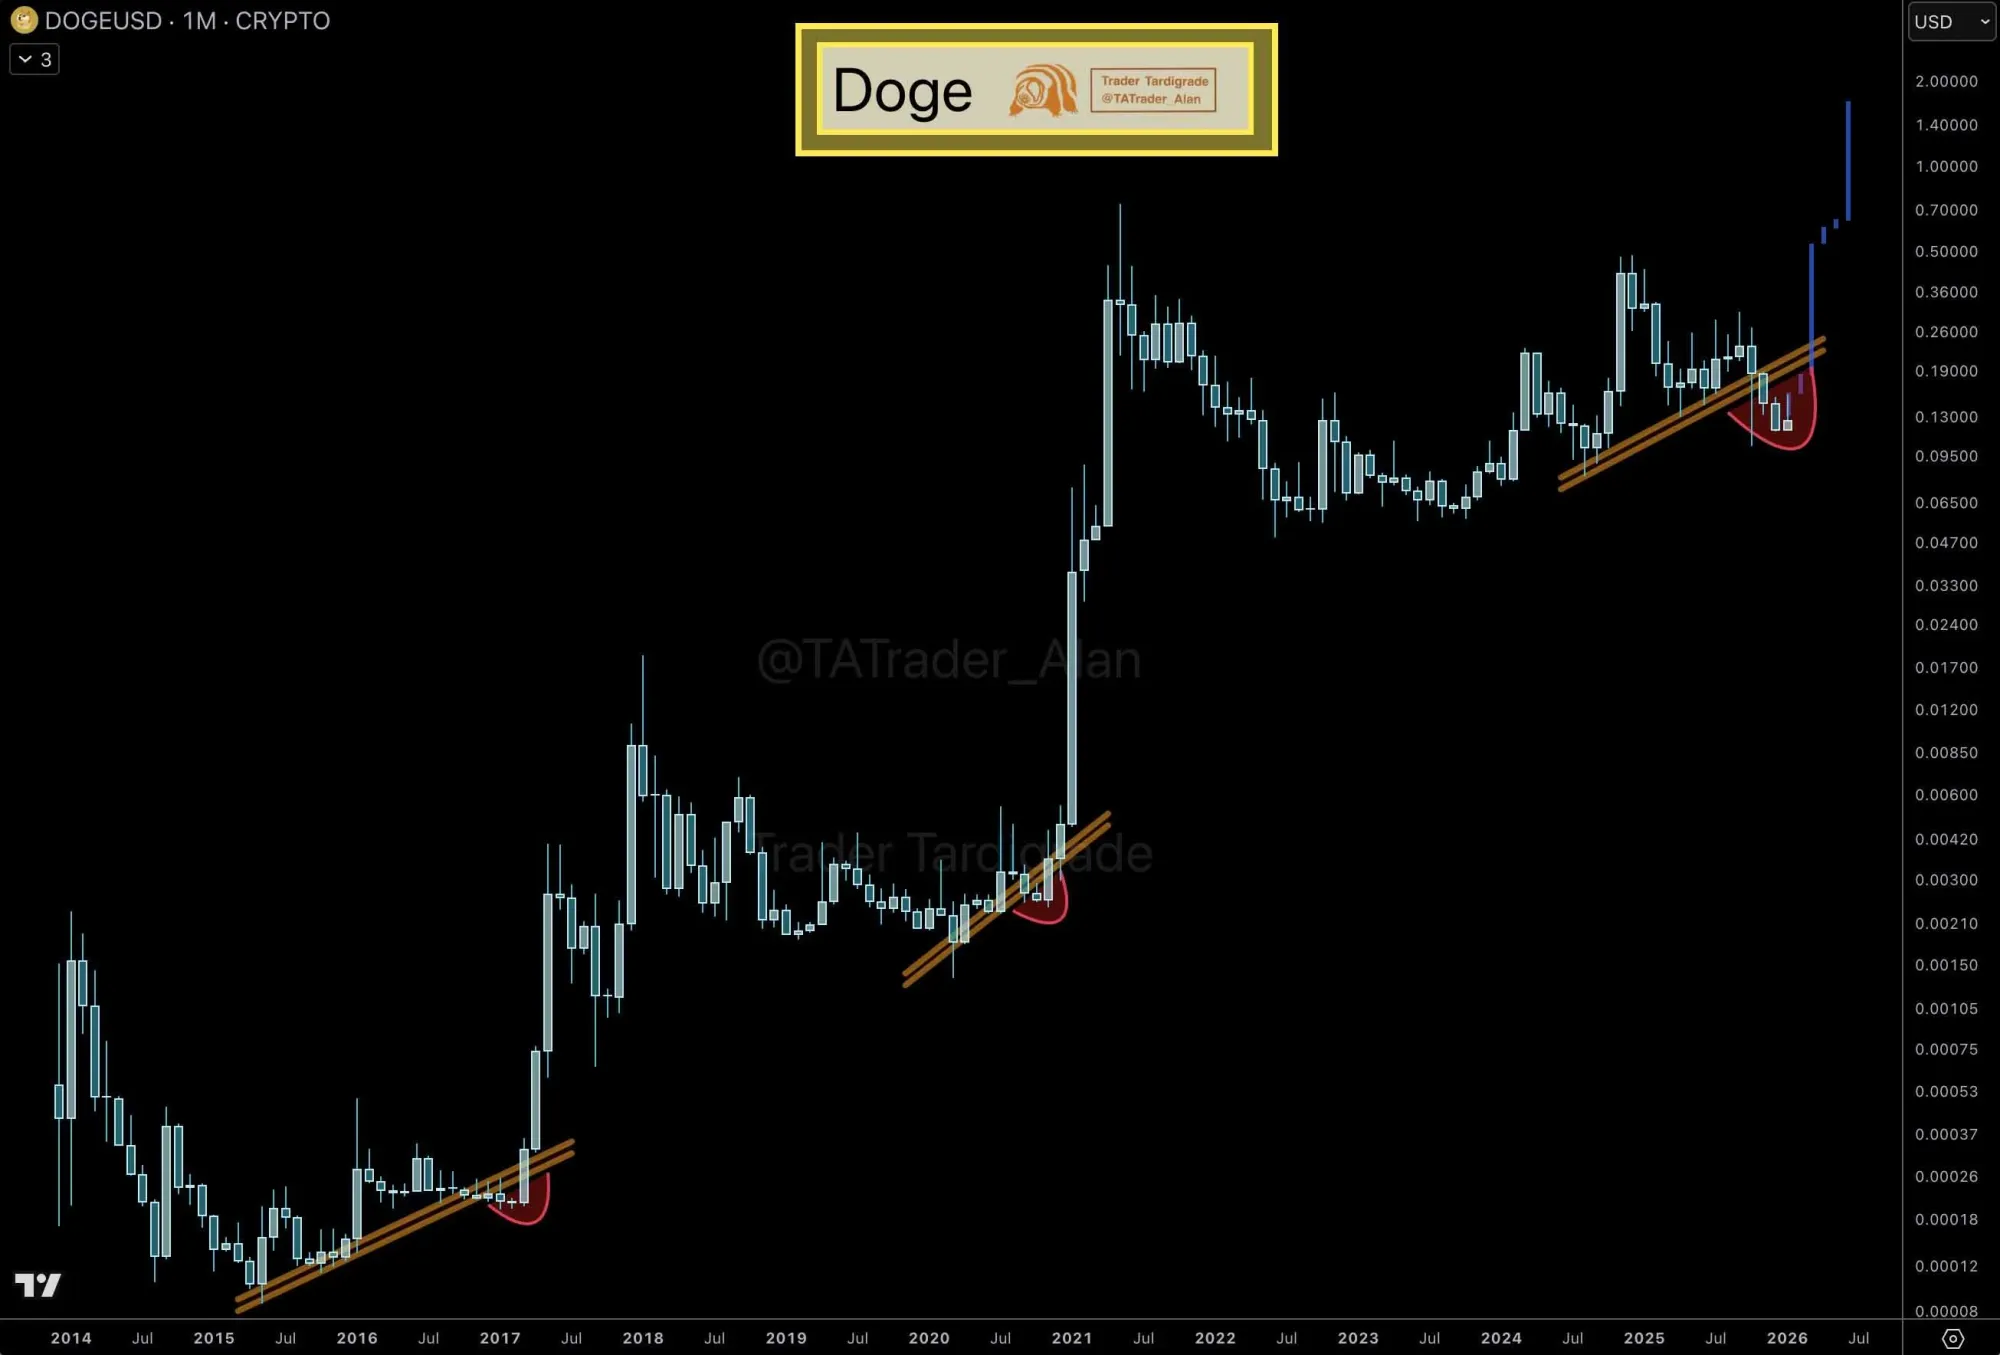
As long as this support zone holds, the overall structure stays intact. The monthly chart displays a clear resistance near $0.29, followed by the historic high of $0.55 and the psychological $1.10 level. These resistances do not necessarily signal a supply‑demand imbalance; rather, they are recurring milestones within the long‑term cycle.
Dogecoin price forecast (2026‑2030)
Looking at longer cycles and analyst viewpoints, Dogecoin’s trajectory appears more linked to cycle expansion than to short‑term swings.
- 2026: If the current structure endures, price could gradually climb into the $0.25‑$0.45 range, driven mainly by bottom‑side expansion.
- 2027: Continuing the upward path, price may stretch to $0.45‑$0.75, representing a continuation phase.
- 2028: Should overall market support persist, the asset could test the prior‑cycle high, hovering between $0.75‑$1.10.
- 2029: After breaking previous highs, price discovery may broaden, potentially reaching $1.10‑$1.50.
- 2030: In a full‑scale expansion scenario, long‑term forecasts extend to the $1.50‑$2.00 band, propelled by cycle dynamics rather than short‑term speculation.
Failure scenario: A sustained break below the $0.10 monthly support would undermine the outlook, possibly sending Dogecoin back into a prolonged consolidation.
Conclusion
The 2026 Dogecoin price outlook hinges more on structural factors than on speculative sentiment. Over the long run, Dogecoin appears to be in a compression phase rather than a collapse, a condition that often precedes larger‑cycle volatility.
Whether the coin can reach $2 is not guaranteed by the charts, but a plausible pathway is illustrated. If the next expansion can recapture historic highs, the $2 psychological barrier will become a focal point. Patience and close monitoring of structural evolution are advisable at this stage.
This article ends here. For further Dogecoin outlooks, search for past Bitaigen (比特根) articles or continue reading the related links below. Thank you for your support!
Related Reading
- Dogecoin 2026‑2050 Price Forecast: Tech, Community & Trends
- Pi Network (PI) Coin Price Forecast 2026‑2030: Trend & Future Outlook
- Bitcoin Halving 2026: Can It Trigger a Massive Price Shock?
💡 Register on Binance with referral code B2345 for the maximum trading fee discount. See Binance complete guide.
⚠️ Risk Disclaimer: Crypto prices are highly volatile. This is not investment advice.


