
 Bitaigen Research
 It is well known that Bitcoin is the largest cryptocurrency in the market, and its price is relatively high, making it unsuitable for every participant to hold. By contrast, Ethereum’s price is more affordable and better suited for average traders who wish to buy, sell, or hold. This article introduces the Ethereum contract fundamentals and explains in detail how to read market chart patterns for contract trading, helping beginners get up to speed quickly.

In this guide we distill the essential points for newcomers to Ethereum contracts on how to interpret market charts. We break down the meaning of bullish and bearish candlesticks, the body and the wicks, and we pair these insights with commonly used timeframes to provide practical tips. The goal is to help you quickly grasp the basic logic of chart analysis and improve the reliability of your trading decisions.
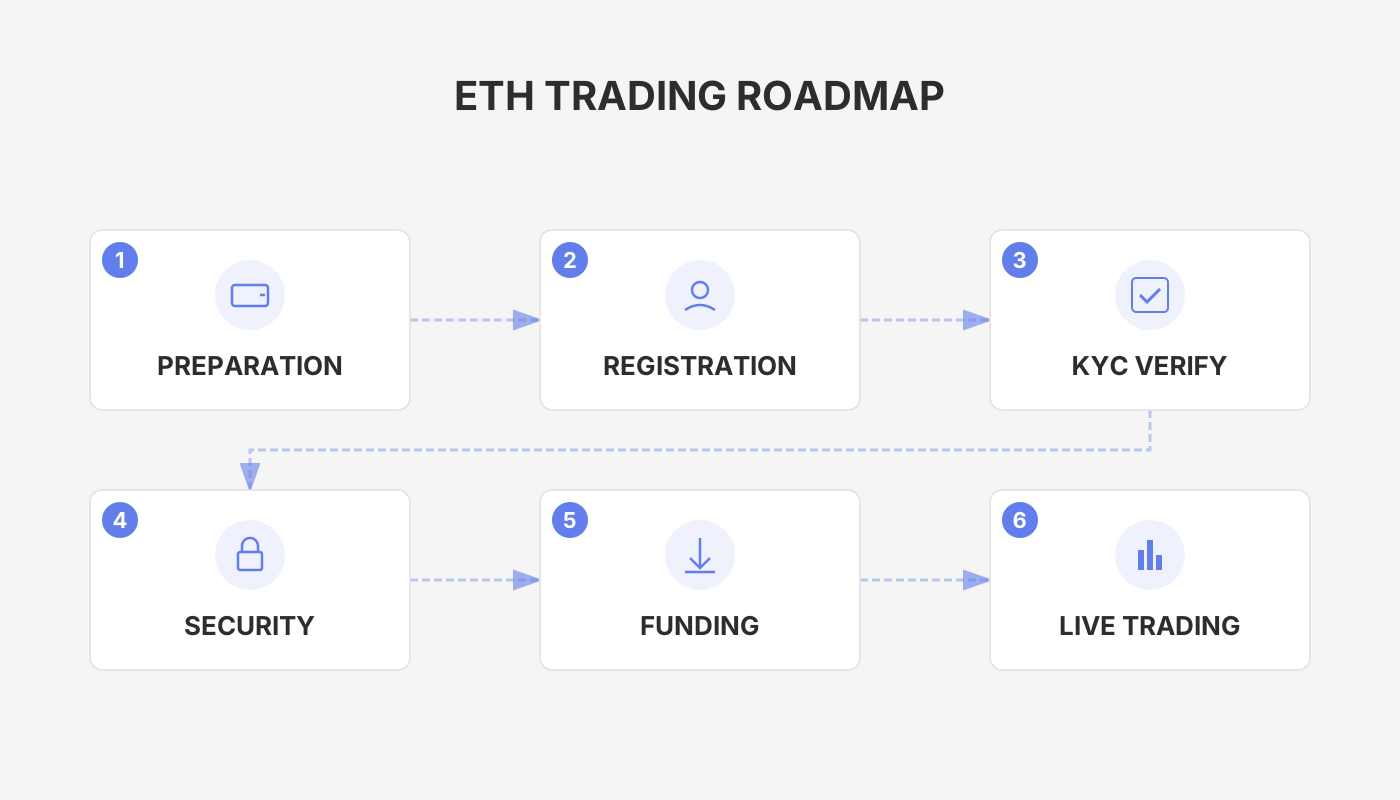
How to Read the Market Chart When Trading Ethereum Contracts?
When you look at an Ethereum contract market chart, focus mainly on the candlestick’s color (bullish or bearish), the size of the body, and the length of the wicks, while also considering the selected time‑frame to gauge short‑term and medium‑term trends.
Ethereum (ETH) currently ranks second by market cap, and its popularity remains high. To profit from Ethereum, you must learn how to read its price charts. Most trading platforms (including Binance Global, Binance.US for U.S. residents, and other major exchanges) provide real‑time market data. Simply open the relevant page to view a variety of time‑frames such as intraday, daily, weekly, monthly, and half‑yearly charts. While charts can help you assess recent price action, the inherent volatility of blockchain assets means you should not rely solely on visual patterns to predict future movements.
Core Elements of a Candlestick Chart
- Bullish vs. Bearish Candles
- Bullish candle (often shown in green) indicates that the closing price is higher than the opening price, suggesting buying pressure and a potential continuation of upward movement.
- Bearish candle (often shown in red) indicates that the closing price is lower than the opening price, suggesting selling pressure and a potential continuation of downward movement.
- Body Size
- A larger body reflects a more decisive battle between buyers and sellers, implying stronger momentum in the direction of the candle.
- A large bullish body signals strong upward momentum; a large bearish body signals strong downward momentum.
- Wick Length
- A long upper wick shows that buyers tried to push the price higher during the interval but were rejected, indicating possible resistance above the current level.
- A long lower wick shows that sellers attempted to push the price lower but were rebuffed, indicating possible support below the current level.
By evaluating these three factors together, traders can obtain a clearer picture of current market sentiment and potential pivot points.
Ethereum Contract Trading Tips
1. Trading Hours
- Contract trading operates 24/7. There is a brief interruption each Friday at 16:00 (UTC+8) for settlement or delivery.
- During the final 10 minutes before settlement, only position closures are allowed; opening new positions is prohibited.
2. Order Types
| Type | Direction | Description |
|---|---|---|
| **Buy to Open Long** (Bullish) | Long | Anticipate price rise; add a new long position |
| **Sell to Close Long** (Long liquidation) | Long | Anticipate price will stop rising; reduce the long position |
| **Sell to Open Short** (Bearish) | Short | Anticipate price decline; add a new short position |
| **Buy to Close Short** (Short liquidation) | Short | Anticipate price will stop falling; reduce the short position |
3. How to Place Orders
- Limit Order: You set the exact price and quantity. Useful for both opening and closing positions.
- Market‑Priced (Counter‑party) Order: You only input the quantity; the system automatically matches the best available counter‑party price, effectively a market‑limit order.
4. Position Management
- Positions of the same contract and the same direction are automatically merged.
- Each contract account can hold up to six distinct positions: weekly contract long, weekly contract short, next‑week contract long, next‑week contract short, quarterly contract long, and quarterly contract short.
5. Order Limits
The platform imposes limits on the number of contracts a single user may hold within a given period and on the size of individual orders, aiming to prevent market manipulation.
6. Funding Your Account (Global Context)
When depositing fiat currency, you can use USD transfers via SEPA or SWIFT networks, depending on your region. U.S. residents must use Binance.US or another U.S.-compliant exchange; the global Binance platform is not available to them.
7. Tax Considerations
Crypto‑related gains may be subject to taxation in your local jurisdiction. It is advisable to keep accurate records of all trades and consult a tax professional familiar with digital assets.
The Role of Technical Indicators in Market Analysis
In the cryptocurrency market, technical indicators serve as supplementary tools for short‑term analysis. Whether or not you rely heavily on them, the ability to read candlestick charts and understand basic data points such as price, volume, high, and low is essential for any crypto participant. These metrics are displayed directly on the market chart and provide valuable reference material for subsequent decision‑making.
The above constitutes a complete breakdown of “How to Read Ethereum Contract Market Charts?” For additional practical resources on Ethereum contract trading, please follow the other articles published by Bitaigen.
Related Reading
- MetaMask Guide: Features, Security & Beginner Tips
- WNXM Token Supply: 1.677 Million Total & Circulating on Ethereum
- Trust Wallet: Features, Cross‑Chain Use Cases & dApp Tips
💡 Register on Binance with referral code B2345 for the maximum trading fee discount. See Binance complete guide.



