
We analyze Pi Network’s current trend and key resistance levels from both technical and price‑structure perspectives, incorporating Fibonacci retracements, Bollinger‑Band squeezes, and other signals to assess the potential impact of the upcoming large token unlocks on market dynamics. This article will help you pinpoint critical short‑term turning points and is worth a careful read.
Technical Overview and Price Structure of Pi Network
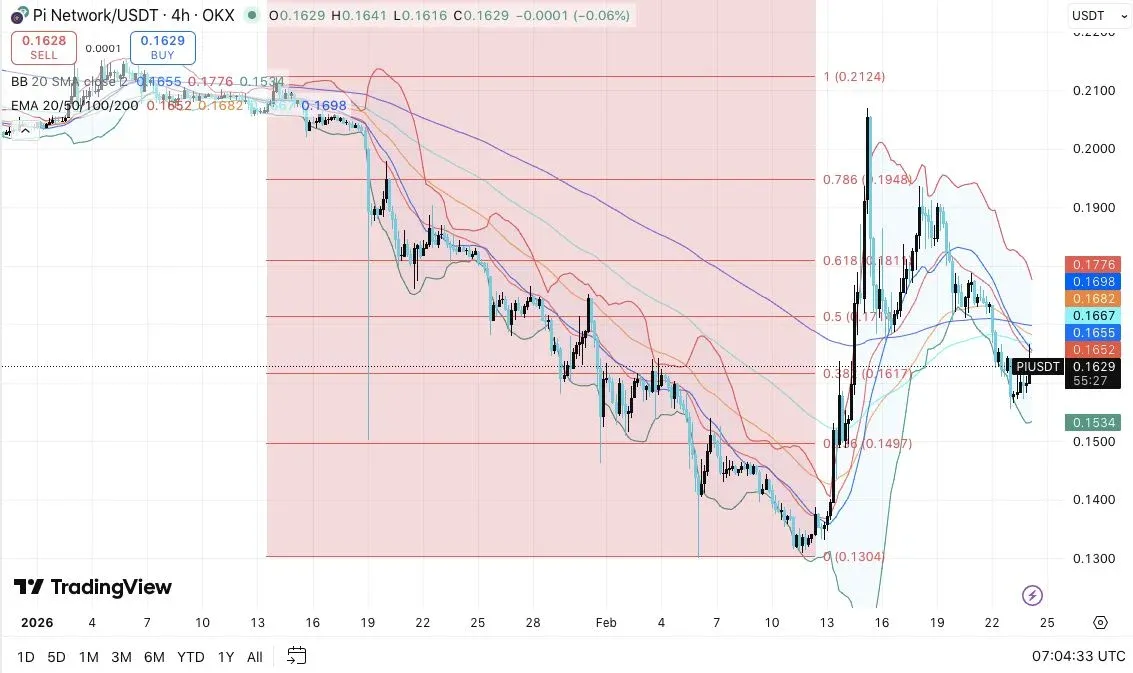
On the 4‑hour chart, the overall direction of PI/USDT remains downward. Although a brief, strong bounce occurred recently, the price has slipped below several important moving averages, leaving short‑term pressure evident. The current trading level hovers around $0.1629, while the EMA band spanning $0.1655‑$0.1698 forms a direct resistance zone. Notably, the price is still below the 200‑day EMA, indicating that the short‑term trend is biased to the downside.
From a Fibonacci‑retracement perspective, Pi previously fell from the 1.0 level near $0.2124 down to $0.1304, after which a V‑shaped rebound emerged. The rally encountered resistance near $0.1948, which coincides with the 0.786 retracement level, and was followed by a sharp sell‑off that reinforced the upper resistance.
Direct resistance: $0.1682‑$0.1698
Upper resistance: $0.1776 (upper Bollinger Band that also acts as structural support), followed by $0.1811 (corresponding to the 0.618 Fibonacci retracement)
If the price can break above the EMA band at $0.1698, it may continue toward $0.1776 and potentially $0.1811. Conversely, a drop below the demand zone at $0.1534 could push the next target to $0.1497 (the 0.236 Fibonacci level); a further breach might see a retest of the historical low around $0.1304.
The Bollinger Bands are currently tightening, suggesting that volatility is being compressed—a typical precursor to a directional expansion. Unless bulls can re‑capture the $0.1698‑$0.1776 range, selling pressure is likely to dominate.
Token Unlocks and Their Impact on Supply
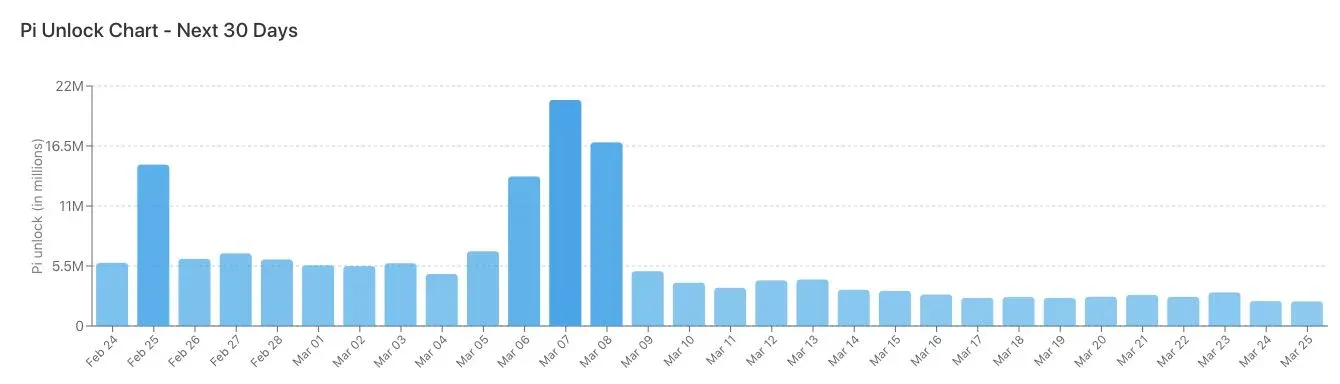
As of 24 February 2026, roughly 5.39 billion Pi remain locked, representing an estimated value of $878 million. Over the next 30 days, 173.12 million Pi are scheduled to enter circulation, accounting for about 3.21 % of the locked supply, with an average daily unlock of 5.77 million Pi. The single‑day unlock on 7 March is projected to exceed 20.7 million Pi, marking the largest release in the near term.
These unlock events will gradually increase the circulating supply and introduce uncertainty to short‑term market sentiment. Because the still‑locked tokens cannot be tracked, traders should monitor liquidity shifts and possible sell‑pressure as the newly released coins become tradable.
Network Scale and Ecosystem Development
Since the network went public, Pi has expanded rapidly across multiple dimensions. Official figures show:
- Over 16.2 million users have migrated to the mainnet
- Approximately 17.7 million users have completed KYC verification
- The ecosystem supports 300+ mainnet applications and 421 k active nodes
- Pi Map lists 148 k merchants and 2.1 million local users
- 111 million Pi have been staked for application ranking
These numbers indicate that while the user base and ecosystem activity continue to grow, price performance has not kept pace.
“Since the open‑network launch, Pi has steadily expanded across ecosystem dimensions—from KYC and mainnet migration to developer activity and overall network participation. These milestones reflect the incremental progress achieved through collective effort.”
— Pi Network (@PiCoreTeam) 24 February 2026
Technical Outlook and Potential Price Ranges
Synthesizing the current technical signals, the key price zones for PI are:
- Upside potential: Breaching the EMA band at $0.1682‑$0.1698 could allow a test of $0.1776; if momentum strengthens further, the ceiling may reach $0.1811 (the 0.618 Fibonacci level), after which a pullback toward $0.1948 (the 0.786 level) is plausible.
- Downside support: The primary support sits at $0.1534; a break below that shifts the next support to $0.1497, and a further failure could drive the price back toward the historic low of $0.1304.
- Resistance & support: The 200‑day moving average and the $0.1698 zone are pivotal for mid‑term stabilization. Failure to surpass these levels may keep the price confined within a retracement corridor.
The Bollinger‑Band squeeze signals compressed volatility, often preceding a period of heightened price swings. Unless buyers can reclaim higher structural levels, the current formation remains bearish.

Can a Short‑Term Rebound Occur?
Pi’s short‑term trajectory hinges on whether bulls can defend the $0.1534 support and apply effective pressure against the $0.1698 resistance. If the upcoming token unlocks help rebalance supply and demand favorably, the price could climb back to $0.1776 or even $0.1811. Conversely, a breach of $0.1534 would likely shift market focus back to the $0.1304 low.
Overall, the interplay between technical compression and supply‑side dynamics will shape Pi Network’s next price path.
---
For additional Pi price forecasts and analyses, feel free to explore prior articles on Bitaigen (比特根) or continue browsing the related content below. Thank you for your ongoing interest and support of Bitaigen!
Note for U.S. readers: Trading Pi on the global Binance platform is not available to U.S. residents; you must use Binance.US or another compliant exchange.
Tax disclaimer: Cryptocurrency gains may be taxable in your local jurisdiction; please consult a qualified tax professional for guidance.
Related Reading
- Bitcoin & 6 Altcoins: Technical Trends & Support Levels
- Pi Network Mainnet 2025: PI Token Price Volatility
- Meme Coins Gain Mainstream Investor Attention
💡 Register on Binance with referral code B2345 for the maximum trading fee discount. See Binance complete guide.
⚠️ Risk Disclaimer: Crypto prices are highly volatile. This is not investment advice.


