
This article examines the recent price movement of SOL from three major dimensions—trading volume, technical indicators, and social sentiment—to determine whether it can firmly hold its key range. By combining on‑chain data with industry viewpoints, we provide a more comprehensive basis for judgment, helping you grasp potential risks and opportunities. Please continue reading.
SOL Price Trajectory: Will Solana Stay Above $180?
As of now, Solana (SOL) is still trading above $180, but multiple factors such as trading volume, technical indicators, and social sentiment create uncertainty about its ability to remain in this range over the long term.

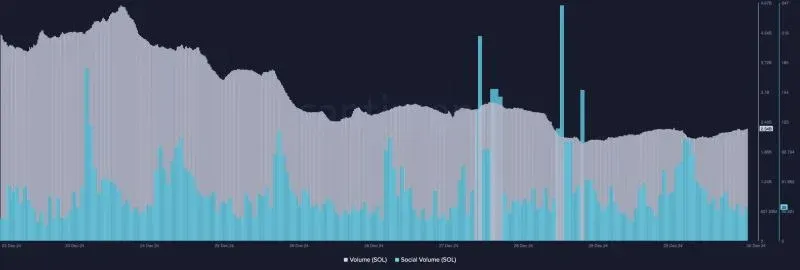
- Over the past seven days, Solana’s trading volume has dropped markedly.
- Key technical indicators suggest that price pressure may continue in the short term.
Critical Price Levels for Solana
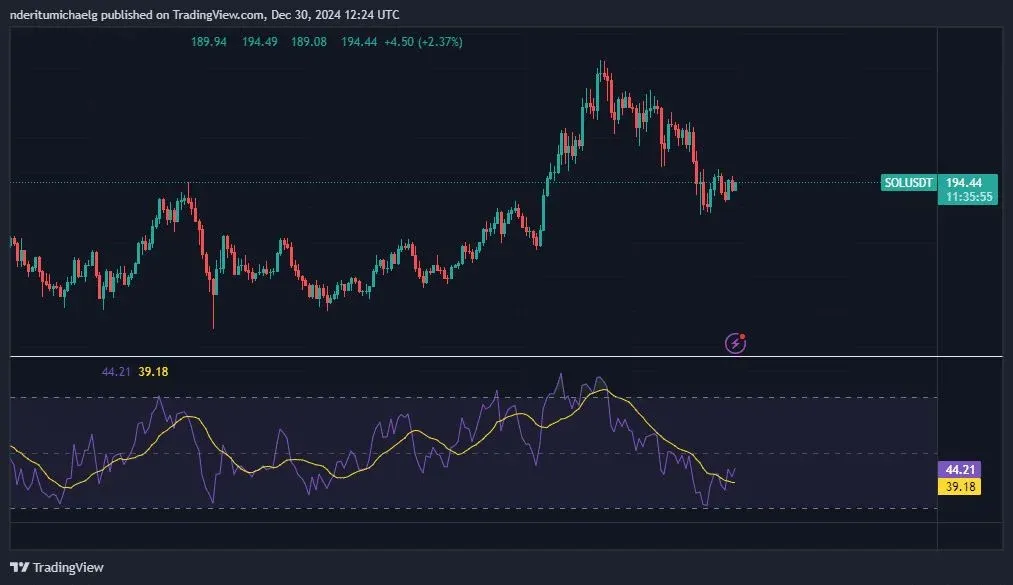
After achieving roughly a 5 % gain in the last week, SOL experienced a pull‑back in the most recent 24 hours. At the time of writing, its market capitalization is about $92 billion, with an average daily trading volume of roughly $193 million.
Renowned crypto analyst Ali Martinez notes that SOL needs to hold the $190‑$180 band; otherwise, a breach could trigger further declines and expose investors to losses. Subsequently, Amb31‑to cross‑checked on‑chain data to assess the probability of a short‑term dip into that zone.
Recent Price Performance
Our analysis of Santi data indicates that the falling volume may foreshadow continued price weakness. Nevertheless, Solana’s social buzz remains elevated, showing that the asset still commands strong attention within the crypto market.
- The long‑/short‑position ratio is rising, indicating that longer‑term holdings outweigh short‑term trades—a bullish signal.
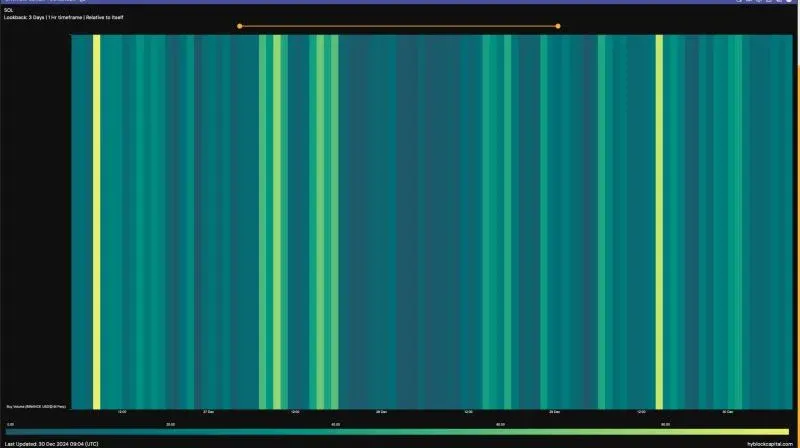
- Ambadito’s analysis of Haibra Capital data similarly shows SOL sitting in a pivotal trading zone.
As of December 29, the buy‑order count reached 86, approaching the threshold of 100, which signals notable buying pressure and is supportive of price.
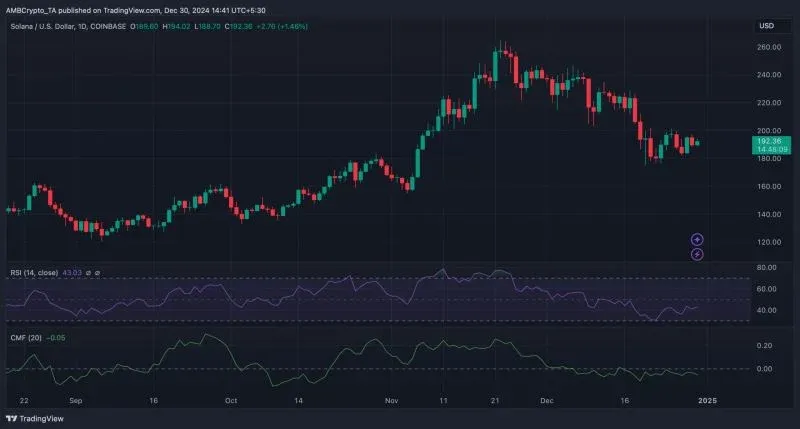
- The Relative Strength Index (RSI) has edged higher, hinting at increased buying activity.
- However, the Chaikin Money Flow (CMF) has declined, suggesting that buying momentum may be waning.
These factors together determine whether SOL will breach the $180 level in the coming days, a scenario that remains to be seen.
Solana’s Weekly Key Metrics: Stablecoin Growth Surpasses $5 Billion
- Solana’s stablecoin market size has rebounded to over $5 billion, mirroring the global stablecoin trend.
- A bear‑market correction has provided modest support for a weekly recovery.
Last week, Solana locked $424.87 million worth of stablecoins, marking the highest weekly growth rate in the past seven days. The surge was driven primarily by USDC and USDT.
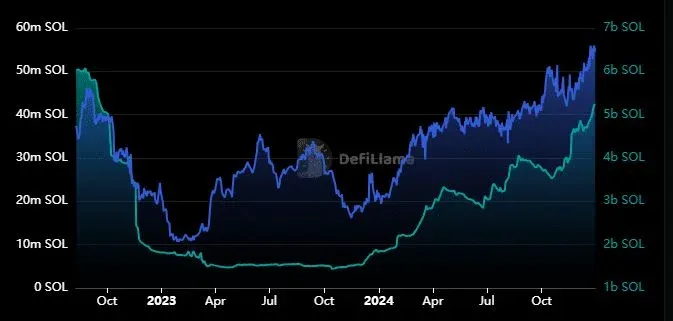
- At the start of 2024, stablecoin value on Solana was $1.83 billion; by December it had risen to a peak of $5.24 billion.
- This week, TVL (Total Value Locked) reached $55 billion, setting a new high for 2025.
Although these metrics are robust, they remain below the historic peak recorded in 2022, indicating considerable upside potential throughout 2025.
Overview of Price Action
During the past week, SOL posted an 11.39 % weekly gain, closing at $194, still trading at roughly a 26 % discount to its November high.
Selling pressure over the last four weeks has eased, suggesting that the bear market may be cooling and that a subsequent recovery could be plausible.
SOL Price Forecast: Backpack CEO Backs, Stock Tests $93 Key Level (2026‑03‑25)
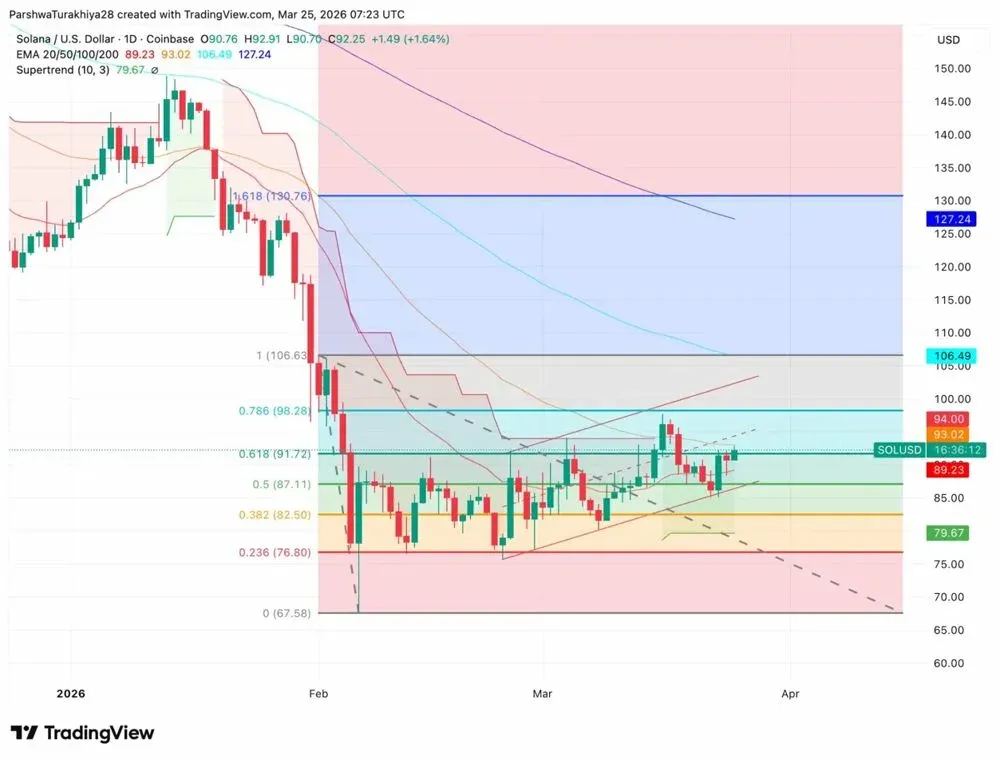
- SOL closed at $92.25, up 1.64 %, with the daily chart positioned within the 0.5‑0.618 Fibonacci zone.
- The U.S. SOL spot ETF recorded a net daily inflow of $4.64 million, bringing cumulative net inflows close to $994.43 million.
- Backpack CEO described SOL as the only crypto network that must be included, calling it the most liquid DeFi market worldwide.
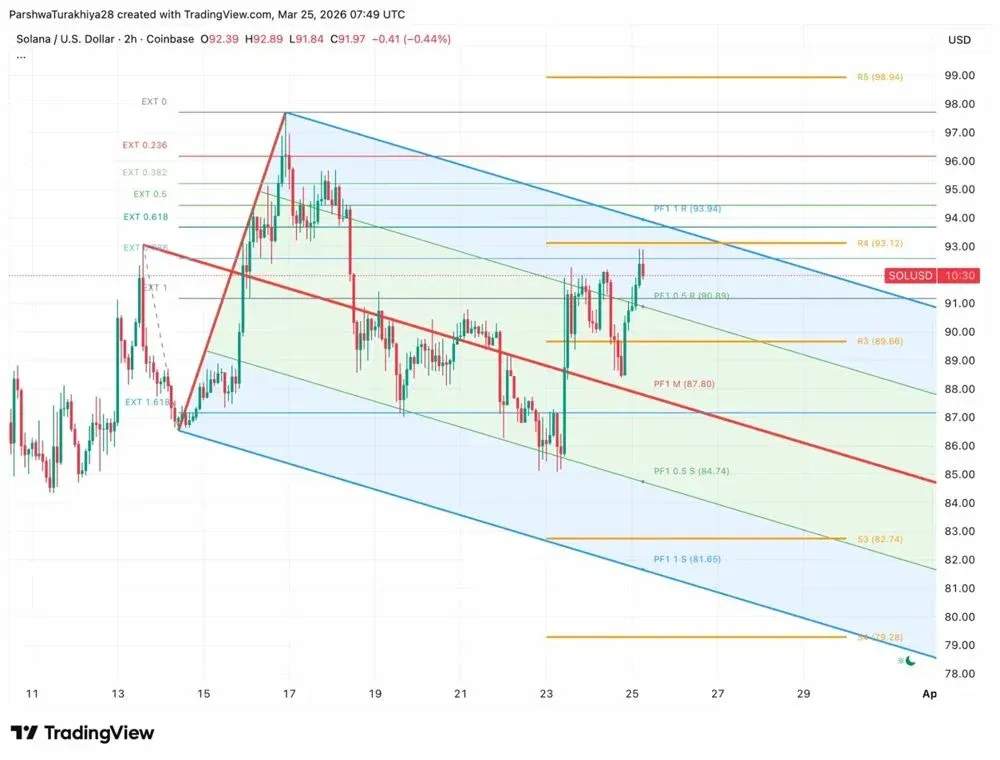
On March 25, SOL remained inside a descending channel on the 2‑hour chart, while the daily chart continued to be pressured by four exponential moving averages (EMAs).
Key Technical Levels
| Indicator | Price (USD) |
|---|---|
| Supertrend support | 79.67 |
| 0.5 Fibonacci support | 87.11 |
| 0.618 Fibonacci resistance | 91.72 |
| 20‑day EMA | 89.23 |
| 50‑day EMA | 93.02 |
| 0.786 Fibonacci target | 98.28 |
| Full retracement level | 106.63 |
2‑Hour Chart Critical Levels
- Upper channel resistance: 93.94
- R4 resistance: 93.12
- R5 resistance: 98.94
- Mid‑point support: 90.89
- Lower support: 84.74
If the 2‑hour closing price breaks above $93.94, the R4 and R5 resistance zones are expected to open. Conversely, a drop below $84.74 could lead to testing of lower support levels.
ETF Flows and DeFi Perspective
On March 24, the U.S. SOL spot ETF logged a net daily inflow of $4.64 million, bringing total net inflows to roughly $994 million. Institutional holdings appear stable, with no significant withdrawals observed. Backpack CEO emphasized SOL’s depth and competitiveness in on‑chain capital markets, providing additional fundamental support.
Price Scenarios
- Bullish: If the 2‑hour close exceeds $93.94 and stays above the 50‑day EMA ($93.02), the first target becomes the 0.786 Fibonacci level at $98.28, with the potential to reach the full retracement level of $106.63. Should ETF cumulative inflows surpass $1 billion, further upside could be triggered.
- Bearish: If price falls below the 20‑day EMA ($89.23) and drops under $87.11, the initial support sits at $82.50 (0.382 Fibonacci). Breaking beneath $79.67 would bring the market close to the February low of $67.58.
Long‑Term Price Outlook (2024‑2035)
- For 2025, SOL is projected to average around $218.82, with a possible high of $234.14.
- By 2030, the average estimate is about $400, and by 2035 it could reach $800.
- Over the long term, SOL is expected to break the $250 barrier during 2025‑2026, after which network growth and enhanced liquidity should sustain an upward trajectory.
Key Support and Resistance
- Support: $19 (weekly low)
- Resistance: $250 (peak)
Market Sentiment
- Sentiment in September 2024 showed slight weakness, yet the overall outlook remained bullish.
Short‑Term Solana Price Forecast (2024‑2025)
| Date | Average Price | Low | High |
|---|---|---|---|
| 2024‑12‑28 | $191.43 | $178.03 | $204.83 |
| 2024‑12‑29 | $192.43 | $178.96 | $205.89 |
| 2024‑12‑30 | $193.38 | $179.85 | $206.92 |
| 2024‑12‑31 | $194.35 | $180.75 | $207.96 |
| 2025‑01‑05 | $199.04 | $185.10 | $212.97 |
| 2025‑01‑10 | $203.94 | $189.67 | $218.22 |
| 2025‑01‑20 | $213.96 | $198.98 | $228.93 |
| 2025‑02‑01 | $218.82 | $203.50 | $234.14 |
| 2025‑03‑01 | $220.84 | $205.38 | $236.30 |
| 2025‑04‑01 | $222.86 | $207.26 | $238.47 |
| 2025‑05‑01 | $224.89 | $209.14 | $240.63 |
| 2025‑06‑01 | $226.91 | $211.03 | $242.79 |
| 2025‑07‑01 | $228.93 | $212.91 | $244.96 |
| 2025‑08‑01 | $230.95 | $214.79 | $247.12 |
| 2025‑09‑01 | $232.98 | $216.67 | $249.28 |
| 2025‑10‑01 | $235.00 | $218.55 | $251.45 |
| 2025‑11‑01 | $237.02 | $220.43 | $253.61 |
| 2025‑12‑01 | $239.04 | $222.31 | $255.78 |
Long‑Term Price Outlook (2025‑2035)
| Year | Average Price | Low | High |
|---|---|---|---|
| 2025 | $241.06 | $192.85 | $289.28 |
| 2026 | $298.61 | $238.89 | $358.33 |
| 2027 | $304.37 | $243.49 | $365.24 |
| 2028 | $373.40 | $298.72 | $448.08 |
| 2029 | $487.88 | $390.31 | $585.46 |
| 2030 | $433.69 | $346.95 | $520.42 |
| 2031 | $616.14 | $492.91 | $739.37 |
| 2032 | $817.45 | $653.96 | $980.94 |
| 2033 | $905.51 | $724.41 | $1,086.62 |
| 2034 | $665.62 | $532.49 | $798.74 |
| 2035 | $775.98 | $620.79 | $931.18 |
The above constitutes Bitaigen’s comprehensive analysis of SOL’s pivotal price movements and its ability to stay above $180. We hope this assists you in understanding Solana’s market dynamics.
*Note for U.S. readers: Access to the global Binance platform is unavailable in the United States; you should use Binance.US for any Binance‑related services.*
*Tax disclaimer: Cryptocurrency gains may be taxable in your jurisdiction; please consult a tax professional for advice.*
Related Reading
- Solana: High‑Performance, Low‑Fee Blockchain for NFTs & DeFi
- PIPPIN Coin: Solana AI‑Meme Mechanism, Tokenomics & Potential
- Solana (SOL) Price Analysis: Technical, Flow & Macro Outlook
💡 Register on Binance with referral code B2345 for the maximum trading fee discount. See Binance complete guide.
⚠️ Risk Disclaimer: Crypto prices are highly volatile. This is not investment advice.


