
In this article we outline the underlying technology and issuance mechanism of the US Dollar Reserve Coin, dissect its liquidity characteristics within the Solana ecosystem, and, by referencing recent market movements, discuss macro‑level factors that could influence its price. Through a multidimensional analysis of on‑chain data and market behavior we aim to help readers form a more objective view. The subsequent sections will also project possible trajectories for 2026, so stay tuned.
What is the US Dollar Reserve Coin (ADR)?
The US Dollar Reserve (ADR) is an SPL token deployed on the Solana blockchain that is marketed around the narrative of a “dollar reserve”. Although the name suggests a peg to the US dollar, the token is not an officially issued stablecoin and carries no fiat‑backing. Its market price is driven entirely by supply‑and‑demand dynamics, on‑chain liquidity, and speculative sentiment.
Core characteristics
- Issued on the Solana mainnet
- Primarily traded on decentralized exchanges (DEXs)
- Price is determined by market buying and selling activity; it is not linked to the US dollar
- Influenced by macro‑economic narrative themes, resulting in noticeable volatility
Because it lacks a fiat anchor, ADR’s price behavior resembles that of many low‑market‑cap tokens: rapid spikes are often followed by corrections.
Market overview and recent chart performance
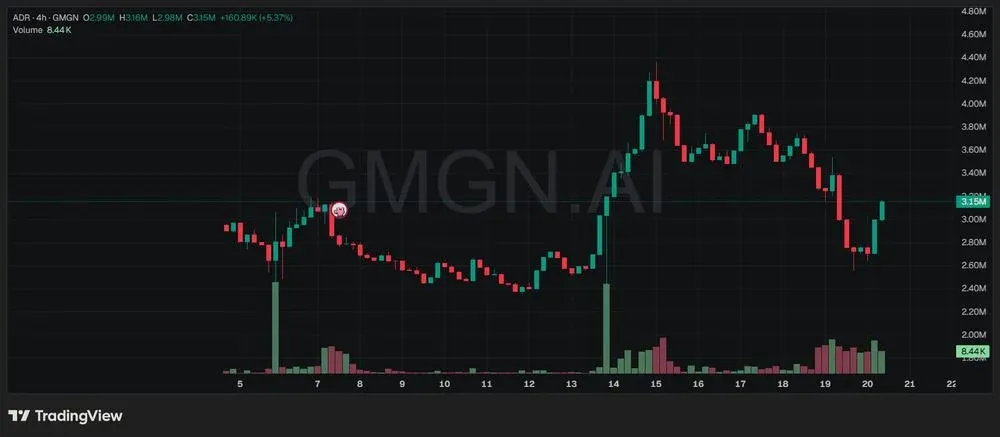
Looking at the 4‑hour timeframe, ADR’s market cap has settled around $3.15 M after its latest pull‑back. Key chart observations include:
- Mid‑term strong uptrend: Between the 14th and 15th of the month the market cap rose from roughly $2.6 M to above $4.3 M, with volume expanding in tandem, indicating clear buying momentum.
- Volume confirmation: Enlarged green volume bars show that the buying pressure is not isolated but supported by a broader set of participants.
- High‑point retracement: After touching a short‑term peak near $4.4 M, the token entered a distribution phase and the market cap fell back into the $2.7 M‑$3.0 M range.
- Support zone: The $2.7 M‑$2.8 M band acted as short‑term support, with price bouncing off this area and attempting to stabilise around $3.1 M‑$3.2 M.
- Volatility pattern: The token exhibits the classic “rapid surge → quick pull‑back → short‑term consolidation” pattern common to small‑cap assets.
These structural traits provide a solid foundation for the price forecasts that follow.
Technical structure analysis
ADR’s price action can be divided into three distinct phases:
1. Accumulation phase
Before the breakout, the price oscillated sideways within the $2.4 M‑$2.8 M corridor, possibly reflecting early positioning by larger holders.
2. Expansion phase
A breakout of resistance sparked a FOMO‑driven buying wave, pushing the market cap rapidly toward $4.4 M as liquidity flooded in and short‑term speculative enthusiasm peaked.
3. Distribution and correction
The subsequent decline from $4.4 M back to $2.7 M suggests profit‑taking and the exit of some large participants.
At present ADR appears to be in a consolidation stage; should it hold above the $2.8 M support, short‑term upside could extend to the $3.6 M‑$3.8 M region. Conversely, a breach of that support could expose the token to a fall toward $2.4 M.
Technical key points
- Short‑term support: $2.7 M
- Immediate resistance: $3.6 M
- Major resistance: $4.3 M‑$4.4 M
- Risk level: $2.4 M
2026 price outlook
Forecasting low‑cap tokens is better suited to scenario‑based modelling rather than linear extrapolation. Based on the current technical landscape and the anticipated steady growth of the Solana ecosystem, we outline four possible quarterly ranges for 2026.
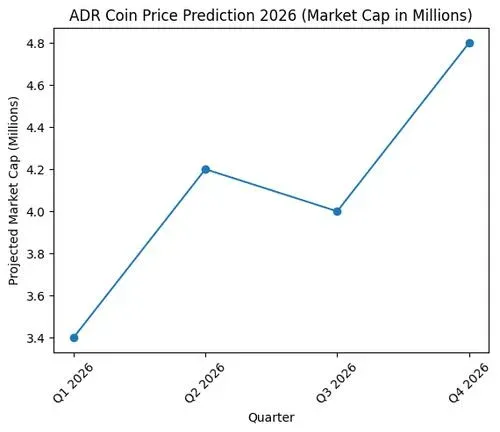
Q1 2026
- Optimistic scenario: Break above $3.6 M and retest the $4.0 M area.
- Pessimistic scenario: Slip below the $2.8 M support and retest $2.4 M.
- Estimated range: $3.2 M‑$3.5 M
Q2 2026
- Bullish view: If Solana liquidity improves, a new high near $4.4 M could be followed by a target of $5.0 M‑$5.5 M.
- Neutral view: Consolidation within the $3.5 M‑$4.5 M band.
- Estimated range: Around $4.0 M
Q3 2026
- If momentum wanes: A pull‑back to roughly $3.2 M.
- If momentum persists: The token remains solidly above $4.5 M.
- Estimated range: $3.5 M‑$4.8 M
Q4 2026
- Bullish view: The macro “dollar reserve” narrative continues to ferment, potentially pushing market cap toward $6.0 M.
- Bearish view: Liquidity dries up, leading to a decline into the $3.0 M‑$3.5 M corridor.
- Year‑end average: $4.5 M‑$5.0 M (contingent on sustained volume growth).
Aggregating all scenarios, the base‑case market‑cap band for 2026 is $3.5 M‑$5.0 M, the upper extreme could exceed $6.0 M, while downside risk clusters around $2.4 M‑$2.8 M.
Investment perspective: Is ADR suitable for you?
The investment merit of ADR is highly dependent on an individual’s risk tolerance and trading style.
Potential advantages
- A clear narrative positioning that makes it easy to attract attention.
- Benefits from the overall liquidity of the Solana ecosystem.
- Has experienced explosive price spikes in the past.
Risk considerations
- Price swings are severe; short‑term declines can exceed 50 %.
- Liquidity is concentrated, so whale activity can move the price dramatically.
- Narrative‑driven demand may evaporate if macro sentiment shifts, reducing buying pressure.
Practical suggestions
- Continuously monitor on‑chain liquidity metrics and the concentration of large‑holder positions.
- Keep an eye on the breakthrough or breakdown of key support and resistance levels.
- Manage position size carefully to avoid over‑exposure within a single volatility cycle.
Active short‑term traders may find ADR’s volatility conducive to profit opportunities, whereas investors seeking more stable assets should weigh its high‑risk profile carefully.
Summary
The price corridor for the US Dollar Reserve Coin (ADR) in 2026 remains contingent on multiple scenarios. Given the present chart structure and volatility traits, ADR could rebound above its support to $4 M+, but it also retains the potential for a swift retreat to $2.4 M‑$2.8 M. Its future trajectory will be shaped by a combination of:
- The extent of liquidity expansion within the Solana ecosystem
- Ongoing market interest in the “dollar reserve” storyline
- Whale behavior and the broader sentiment in the cryptocurrency market
When contemplating entry into ADR, investors should prioritize rigorous risk management and technical confirmation rather than acting on impulse.
Frequently Asked Questions
What is the US Dollar Reserve Coin (ADR)?
ADR is an SPL token on the Solana blockchain that primarily trades on decentralized exchanges. Despite its name, it is not a fiat‑backed stablecoin, nor does it have any official endorsement. Its price is entirely dictated by market supply and demand.
What is the projected price range for ADR in 2026?
Under normal market conditions, the 2026 market‑cap estimate lies between $3.5 M and $5.0 M. With strong trading volume and momentum, the cap could break the $6.0 M threshold.
Is ADR pegged to the US dollar?
No. ADR’s price fluctuates with on‑chain liquidity, order‑book dynamics, and overall market sentiment, not with the USD exchange rate.
What factors could influence ADR’s price forecast?
- Overall liquidity of the Solana ecosystem
- Concentration of holdings and whale transaction activity
- General sentiment and risk appetite across the crypto market
- Sudden spikes or drops in trading volume
- Breakthroughs or failures at technical support/resistance levels
Is ADR appropriate for long‑term holding?
During bullish market cycles ADR may display upward potential, yet its high volatility and dependence on narrative can introduce significant risk. Prospective holders should assess liquidity, market structure, and personal risk tolerance before allocating capital.
Note: Gains from trading or holding cryptocurrencies may be subject to tax in many jurisdictions. Users should consult local tax regulations or a professional advisor to ensure compliance.
---
For users located in the United States, trading on Binance.US (the U.S.‑specific platform) is recommended, while global users may access Binance’s international platform via SEPA, SWIFT, or other fiat on‑ramps for USD transactions.
Related Reading
- HBAR Bullish Breakout: Support Retest Signals Upward Cycle
- Audiera (BEAT) Token Review: Tech, Gameplay & 2025 Forecast
- Bonk Token 2025‑2050 Price Outlook: Tech, Community & Market
💡 Register on Binance with referral code B2345 for the maximum trading fee discount. See Binance complete guide.
⚠️ Risk Disclaimer: Crypto prices are highly volatile. This is not investment advice.


