
At the beginning of 2026, sentiment in the crypto market displayed a marked slump and a sense of bewilderment.
Since Bitcoin’s historic peak in October 2025, the price has retraced roughly 36%, with bulls and bears locked in a tangled battle. What unsettles many investors more than the price swing itself is the near‑total failure of the multiple technical indicators that have traditionally been used to gauge market conditions.
Over the past four years, the S2F model’s $500 k target for Bitcoin has diverged from the actual price by more than threefold; the Pi Cycle Top has emitted no signal throughout an entire cycle; the traditional thresholds of the MVRV Z‑Score have not been triggered; and the “rainbow chart” top‑range has become virtually unreachable. At the same time, the Fear‑and‑Greed Index has repeatedly given opposite‑direction readings, and the long‑awaited “alt‑season” has still not materialised.
PANews has systematically reviewed the eight hot‑topic indicators that are currently considered ineffective, probing whether their breakdown stems from short‑term deviations or deeper structural changes.
---
We find that, in early 2026, conventional technical signals in the crypto market have largely lost their relevance. Behind this lie structural forces such as institutional inflows, declining volatility, and a shift in asset characteristics. This article methodically catalogs the eight failing indicators, dissects their root causes, and offers a conceptual framework to help readers reassess the applicability of analytical tools in the new environment.
Common Structural Factors Behind the Failures
- Institutionalisation shock: The influx of institutional capital via Bitcoin ETFs, corporate treasury allocations, CME derivatives, and pension‑fund participation has reshaped the market’s microstructure. Institutions tend to buy on dips and hold for the long term, smoothing price movements and rendering indicators that depend on extreme sentiment or sharp swings largely impotent.
- Volatility decline: Bitcoin’s annualised volatility has fallen from historically above 100 % to roughly 50 %, stripping models such as Pi Cycle Top and the rainbow chart of the large‑price moves they require to trigger.
- Asset‑class migration: Bitcoin is transitioning from a “digital commodity” to a macro‑financial asset, with price drivers increasingly tied to global monetary policy, liquidity conditions, and geopolitical events rather than on‑chain activity alone.
- On‑chain data dilution: Layer‑2 transactions, internal exchange settlements, and ETF custodial mechanisms diminish the representativeness of on‑chain volume and holding‑cost metrics, distorting indicators like NVT and MVRV that rely on raw blockchain data.
- Curve‑fitting on limited samples: Most classic indicators were calibrated on only three to four halving cycles; when the market environment undergoes a qualitative shift, these parameters are prone to break down.
---
The Four‑Year Cycle Theory: A Weakening Halving Effect
The four‑year cycle theory has long been treated as Bitcoin’s “golden rule.” Its core premise is: accumulation occurs before a halving, a 12‑ to 18‑month post‑halving surge follows, then a 75 %‑90 % correction, after which a new bear‑market bottom sets the stage for the next cycle. The model performed well around the 2012, 2016 and 2020 halvings.
However, the most recent halving in April 2024 did not ignite the anticipated explosive rally. Bitcoin’s annualised volatility slid from historic highs above 100 % to about 50 %, producing a gentler “slow‑bull” trajectory. Bear‑market drawdowns have also narrowed; the 2022 decline from peak to trough was 77 %, lower than the 86 % drop in 2014 and the 84 % dip in 2018.
Community discussion points to sustained institutional inflows as the primary catalyst for the four‑year cycle’s erosion. After the launch of a spot Bitcoin ETF in the United States, capital has been steadily absorbed, creating a relatively stable demand floor. Simultaneously, the 2024 halving cut the block reward to 3.125 BTC, reducing daily new supply from roughly 900 BTC to 450 BTC—a yearly supply contraction of about 164 k BTC, which lowered the inflation rate from 1.7 % to roughly 0.85 %. Compared with a market cap measured in the trillions of USD, this supply reduction exerts only a modest direct upward pressure on price.
---
Pi Cycle Top: Structural Volatility Decline Nullifies the Moving‑Average Crossover
The Pi Cycle Top, devised by Philip Swift, signals a top when the 111‑day moving average (MA) crosses above twice the 350‑day MA. The model correctly flagged tops in the 2013, 2017 and April 2021 bull markets.
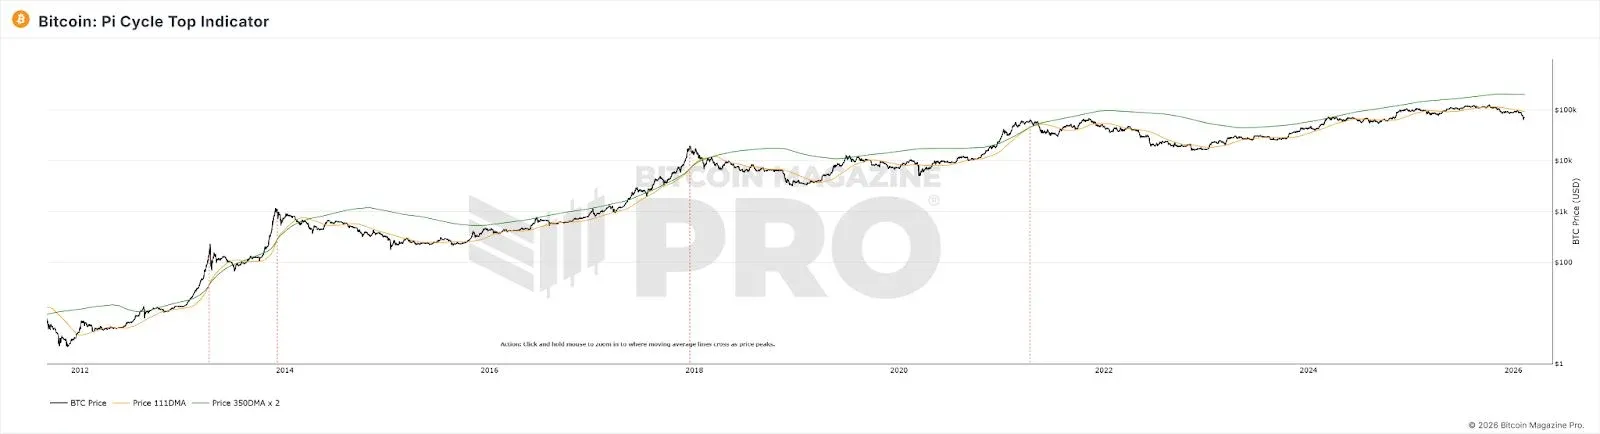
During the 2025 bull run, the two averages never produced a pronounced crossover, leaving the indicator silent. Its failure stems from a fundamental reliance on large price swings to create a noticeable deviation between short‑term and long‑term averages. With ETFs and institutional capital smoothing Bitcoin’s price path, the parabolic, retail‑driven surges that once drove the crossover have largely vanished. Moreover, the indicator is essentially a curve‑fit to early‑period data (2013‑2021); the profound shift in market participant composition renders its original parameters obsolete.
---
MVRV Z‑Score: Evolving Market Scale and Holding Behaviour Suppress the Threshold
The MVRV Z‑Score gauges valuation by comparing Bitcoin’s market value (MV) with its realized value (RV). Traditionally, a Z‑Score above 7 signals “overheating,” while a score below 0 indicates “extreme undervaluation.”
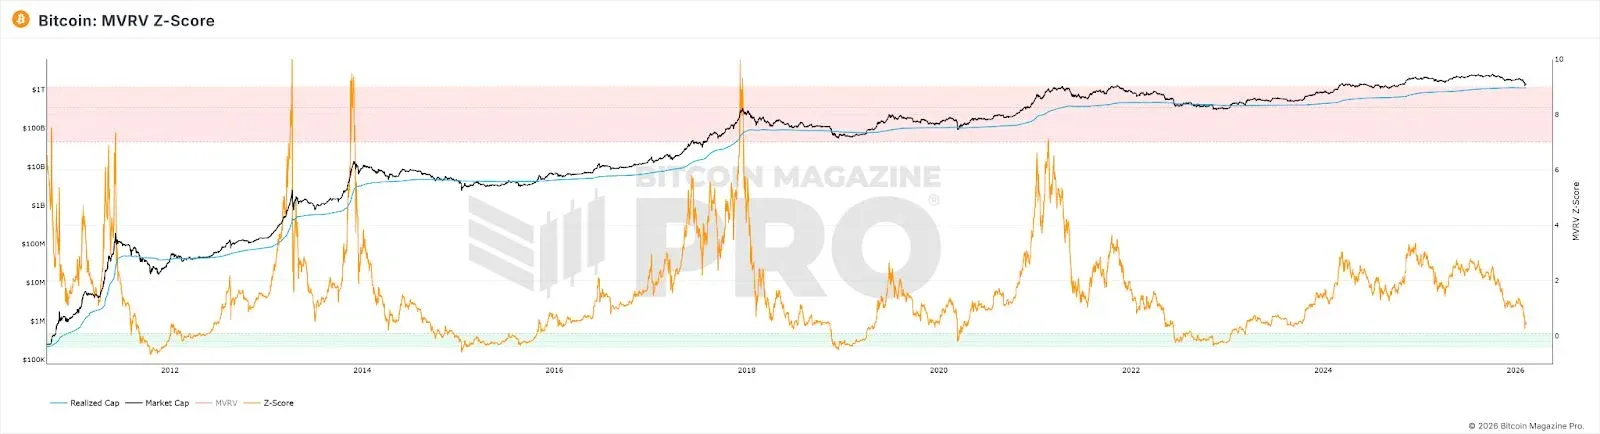
Even at the 2021 bull‑market apex, the Z‑Score never reached the high levels seen in prior cycles, and the fixed > 7 threshold was never triggered. By 2025, despite a price peak, the Z‑Score’s maximum was merely 2.69.
Potential drivers include:
- Institutions buying at high levels and holding long‑term, systematically raising the RV and pulling it closer to MV, thereby compressing the MVRV spread.
- High‑frequency traders constantly refreshing the active supply’s RV, keeping it near the current price and further narrowing the MV‑RV gap.
- As total market cap expands, achieving extreme Z‑Score values demands exponentially larger capital inflows.
These three forces collectively cap the Z‑Score, making the historic “7 = overheated” benchmark no longer applicable.
---
Rainbow Chart: Log‑Growth Assumptions Outpace Actual Momentum
The rainbow chart fits a logarithmic curve to Bitcoin’s long‑term price trajectory and partitions the price axis into colour bands ranging from “extremely undervalued” to “bubble‑max.” Historically, the 2017 and 2021 peaks landed deep within the red zone, coinciding with cycle tops.
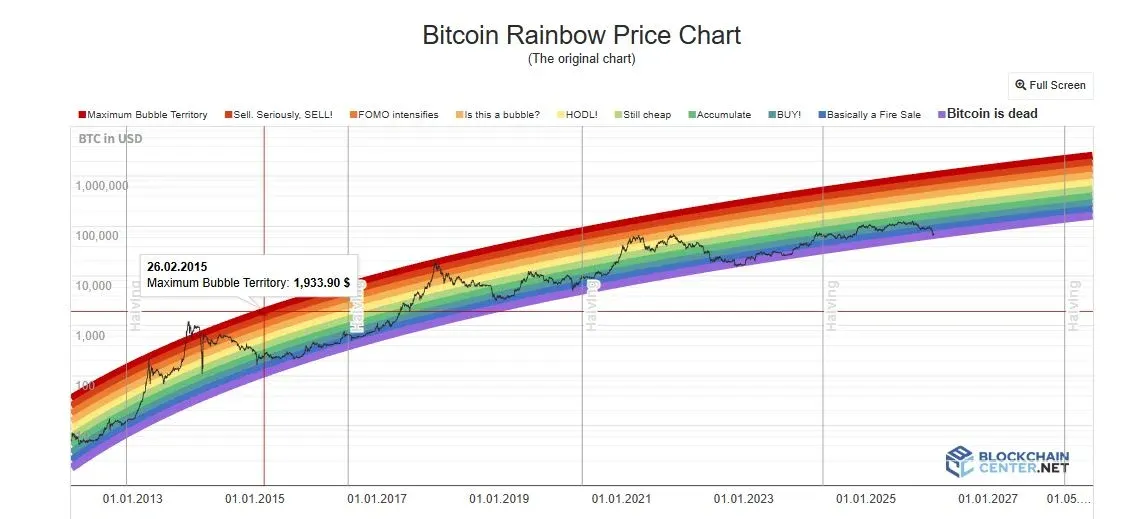
During the 2024‑2025 rally, Bitcoin’s price hovered consistently within the neutral “HODL!” band and never approached the deep‑red zone, rendering the top‑prediction function practically inert. The model’s limitation lies in treating price solely as a function of time, ignoring variables such as halvings, ETFs, institutional capital, and macro‑policy shifts. Institutionalisation has dampened volatility, causing price deviations from the trend line to contract systematically; a fixed‑width colour band therefore becomes difficult to breach. Additionally, Bitcoin is moving from a steep S‑curve adoption phase toward a mature‑asset, slow‑growth stage. The extrapolated logarithmic growth rate exceeds actual growth, keeping price long‑term below the central line.
---
Alt‑Season Index and BTC Dominance: Changing Capital‑Flow Logic
The Alt‑Season Index measures the proportion of the top 100 altcoins that out‑perform Bitcoin over the past 90 days; a reading above 75 is interpreted as an “alt‑season.” BTC Dominance (Bitcoin’s market‑cap share of total crypto market cap) falling into the 40 %‑50 % range traditionally signals capital flowing from Bitcoin into altcoins. Historically, BTC Dominance dropped from 85 % to 33 % in 2017 and from 70 % to 40 % in 2021, each time accompanying a surge in altcoin activity.
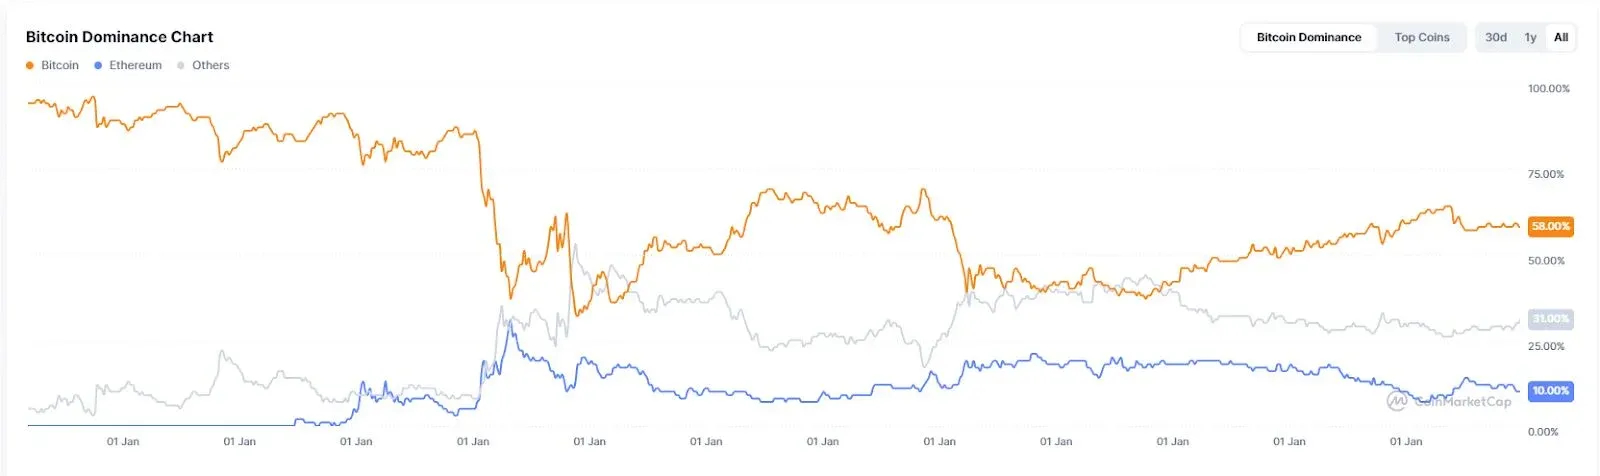
In 2025, the Alt‑Season Index lingered below 30 for an extended period, indicating a persistent “Bitcoin season.” BTC Dominance peaked at only 64.34 % and never breached the 50 % threshold. Entering 2026, the so‑called “Alt‑season” manifested more as sector‑specific rotations (AI, Real‑World‑Asset tokens, etc.) rather than a broad‑based rise across all altcoins.
The deep‑rooted cause is that institutional and ETF capital exhibits a markedly higher risk‑appetite for Bitcoin than for altcoins, while a large share of inflows is being siphoned into AI‑related projects and precious‑metal‑linked products. ETFs hold financial securities, not ecosystem entry tickets, so they do not naturally rotate capital between Bitcoin and altcoins. Simultaneously, narrative fatigue and weakened liquidity support within the altcoin ecosystem have stalled the emergence of a full‑blown alt‑season.
---
Fear‑and‑Greed Index: Institutional Behaviour Severed the Sentiment‑Price Transmission
The Crypto Fear‑and‑Greed Index aggregates volatility, market momentum, community sentiment, Google Trends and other factors into a 0‑100 score. Conventional wisdom treats extreme fear as a buying signal and extreme greed as a selling cue.
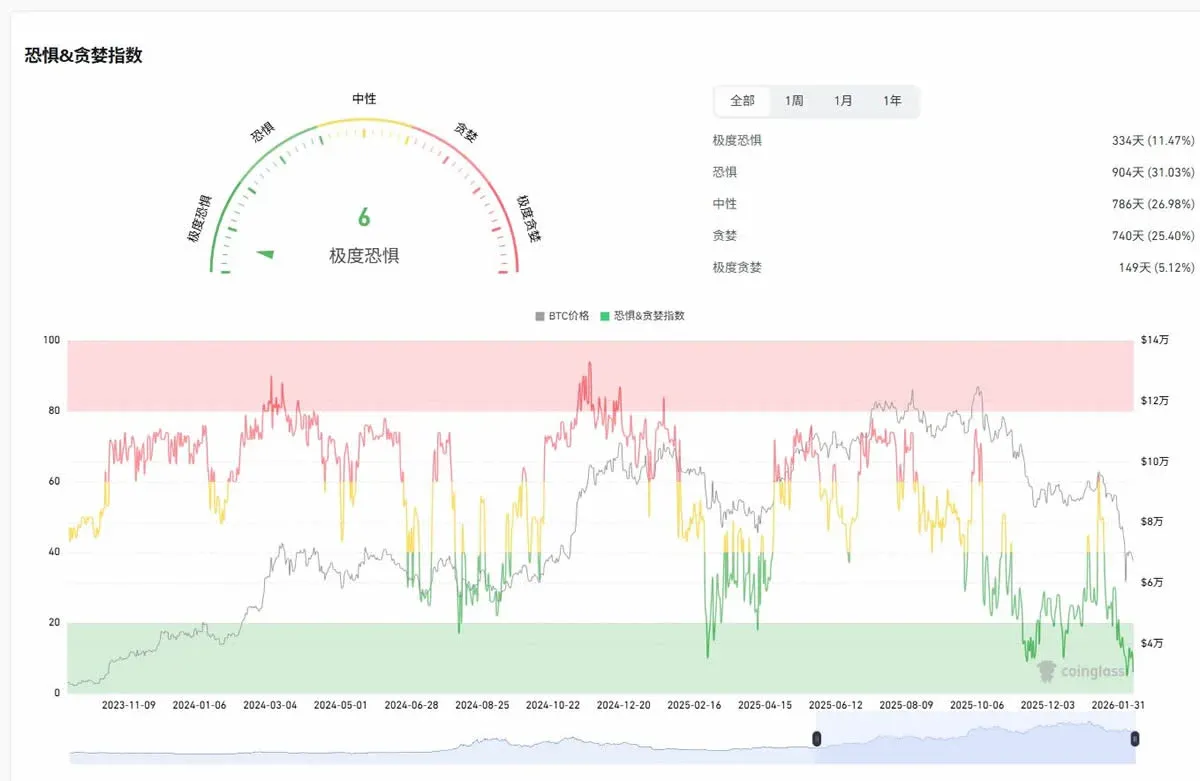
In April 2025 the index fell beneath 10, even lower than the level seen during the 2019 FTX collapse, yet it failed to trigger the expected robust rebound. The 30‑day average for the year was only 32, with 27 days spent in the fear or extreme‑fear zone. At the market high in October, the index hovered around 70, offering no reliable top warning.
The breakdown originates from a decoupling of the sentiment‑price transmission chain by institutional actions: when retail investors panic, institutions may be buying the dip; when retail greed spikes, institutions often hedge via derivatives. Consequently, retail sentiment no longer dominates price formation.
---
NVT Ratio: On‑Chain Transaction Volume No Longer Mirrors Economic Activity
The Network‑Value‑to‑Transactions (NVT) ratio divides market cap by daily on‑chain transaction volume, functioning as a crypto‑specific price‑to‑earnings analogue. A high NVT can imply overvaluation, while a low NVT may suggest undervaluation.
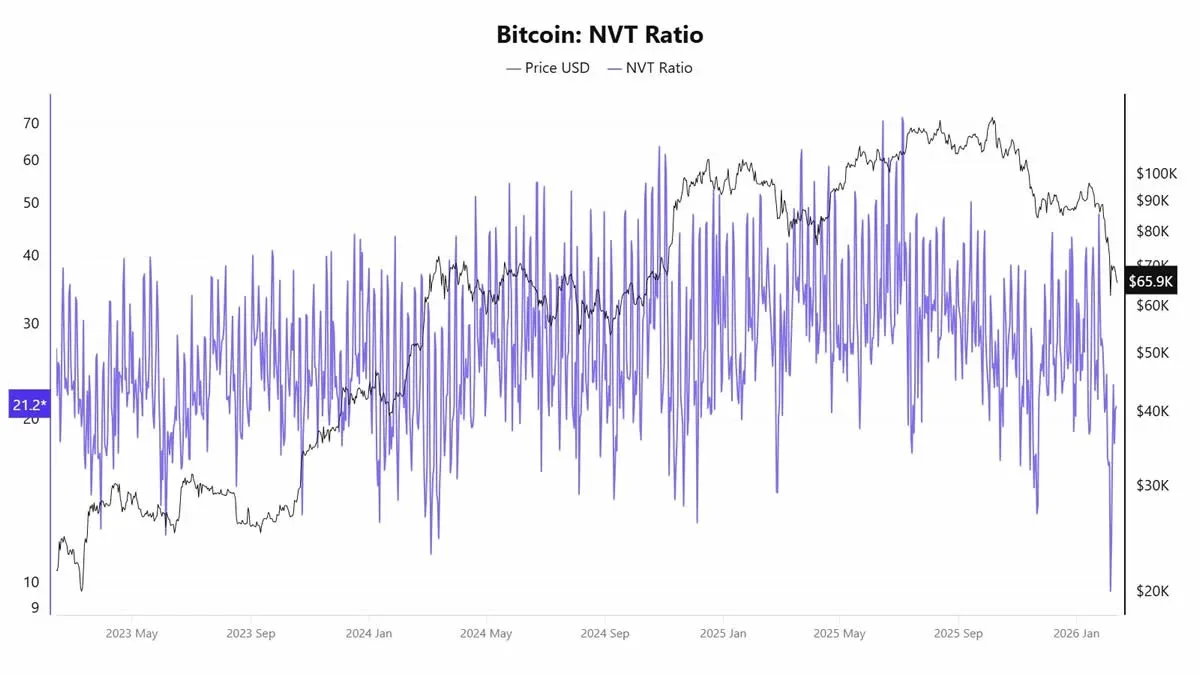
In 2025 a striking inconsistency emerged: in April, before any substantial price rise, the NVT “golden cross” had already reached 58; yet by October, when price approached $120 k, the metric still indicated undervaluation. The core issue is that on‑chain transaction volume no longer accurately reflects genuine economic activity on the Bitcoin network. Layer‑2 solutions, internal exchange settlements, and ETF custodial holdings all dilute the representativeness of raw transaction data.
---
S2F Model: Ignoring Demand While Focusing Solely on Supply
The Stock‑to‑Flow (S2F) model, introduced by PlanB in 2019, borrowed precious‑metal valuation logic, using Bitcoin’s existing stock divided by its annual inflow to gauge scarcity, and applied a logarithmic regression to forecast price. Its central assumption: each halving doubles the S2F ratio, prompting exponential price appreciation.
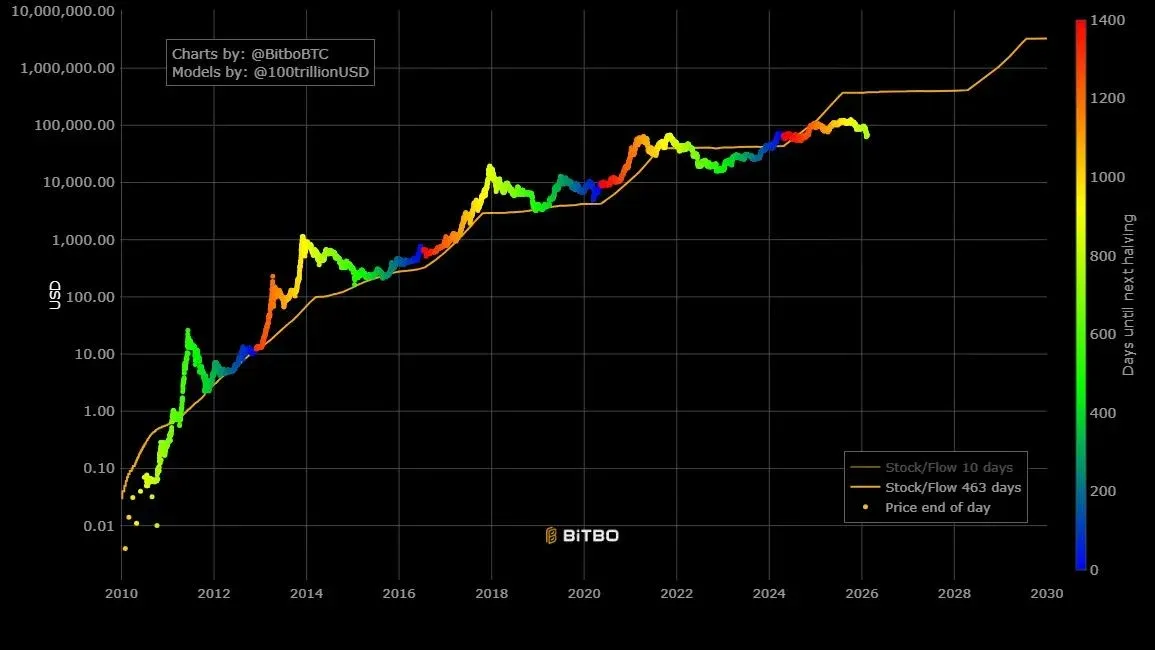
Prediction errors have widened over time: the December 2021 forecast projected Bitcoin near $100 k; the actual price was about $47 k, a deviation of over 50 %. The 2025 model target of $500 k versus the realized price of roughly $120 k represents a gap exceeding threefold. The model’s failure lies in its exclusive focus on supply‑side dynamics, neglecting demand‑side shifts. Once Bitcoin’s market cap entered the trillion‑USD range, exponential growth became physically implausible, and diminishing marginal returns emerged as an unavoidable reality.
---
Conclusion: Indicator Failures Mirror Structural Market Transformation
When the eight failing indicators are examined collectively, a clear pattern emerges: they are not isolated technical glitches but rather reflections of altered underlying market assumptions.
- Institutionalisation reshapes capital composition and price‑discovery mechanisms, smoothing volatility and weakening signals that depend on emotional extremes or sharp moves.
- Volatility decline directly disables models such as Pi Cycle Top and the rainbow chart that require large price excursions.
- Asset‑class migration erodes the explanatory power of on‑chain metrics, rendering NVT, MVRV and similar tools increasingly noisy.
- On‑chain data dilution combined with limited historical samples for curve‑fitting causes many models to lose relevance in the new environment.
For the average investor, the collective breakdown of these indicators underscores the importance of understanding each tool’s underlying assumptions and applicability, rather than chasing a “one‑size‑fits‑all” signal. In a period where foundational rules are being rewritten, maintaining analytical flexibility is the most prudent strategy for navigating uncertainty.
This text constitutes the full analysis of “Eight Classic Crypto Indicators That Have Lost Their Edge and the Structural Reasons Behind Their Failure.” For more articles of a similar nature, continue following Bitaigen (比特根).
*Note on fiat transactions:* When converting crypto proceeds to fiat, most global users transact in USD via SEPA or SWIFT channels. U.S. residents should use Binance.US rather than the global Binance platform. Crypto gains may be taxable in your jurisdiction; consult a local tax professional for guidance.
💡 Register on Binance with referral code B2345 for the maximum trading fee discount. See Binance complete guide.


