
This article was carefully composed by the Bitaigen editorial team, focusing on the recent technical trends and macro signals of Bitcoin and six major altcoins. We conduct secondary verification across multiple time frames, dissect key support and resistance levels, and aim to help you capture potential short‑term and swing‑trade opportunities. For detailed price forecasts and operational guidance, please continue reading.
Market Overview
Recently, the altcoin market as a whole is edging toward several critical technical nodes. Some assets are showing clear downward pressure, while others may experience rebounds. During Bitcoin’s range‑bound phase, investors should pay particular attention to candle‑close behavior near confirmed support and resistance zones. When combined with the prevailing macro sentiment and cross‑market indicators such as TOTAL3 and BTC.D, the short‑term downside risk for altcoins remains elevated. Maintain disciplined trading practices and be sure to obtain secondary confirmation across multiple time frames before making any decisions.
---
Bitcoin (BTC) Price Outlook
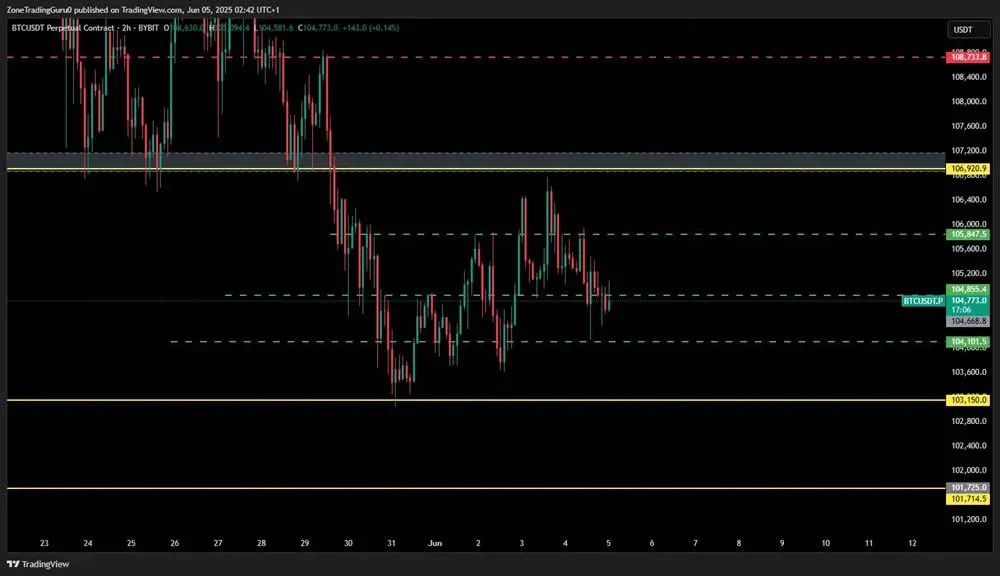
Bitcoin is currently oscillating within the $106,920 ~ $103,150 range. Any breakout—upward or downward—from this corridor could set the tone for the next market leg. Notably, recent long positions accumulated near $103,150 are targeting roughly $106,800. The sub‑levels $104,100, $104,855, $105,850 also present opportunities for scalp‑type short‑term trades.
From a macro perspective, overall market risk appetite appears to be waning. Divergence between strength indicators and the RSI suggests heightened caution toward altcoins. TOTAL3 has missed a retest support around $794.23 billion. Should daily closes hold above and rebound toward $933.22 billion, altcoin upside may persist; otherwise, an upward divergence in BTC.D paired with bearish signals would hint at short‑selling chances for altcoins.
---
Individual Token Analysis
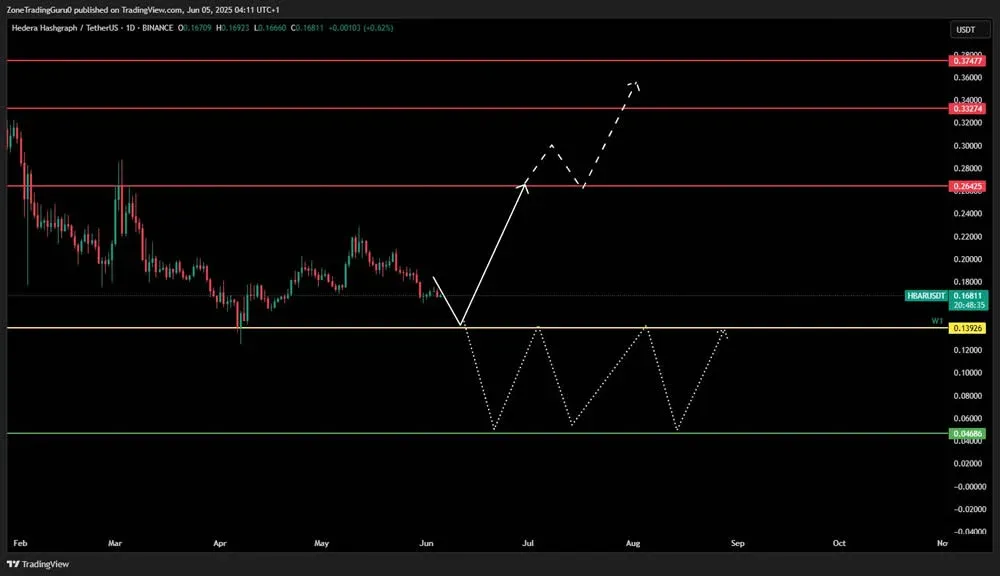
HBAR
After an approximate 8‑fold rally, HBAR is now correcting toward a pivotal support at $0.13926. A bounce from this level would likely aim for an upside target near $0.26425; a weekly close sustaining above the resistance could raise the probability of further moves toward $0.33274 and $0.37477. Conversely, a break below $0.13926 may usher the coin into a prolonged consolidation within its previous bottom range.
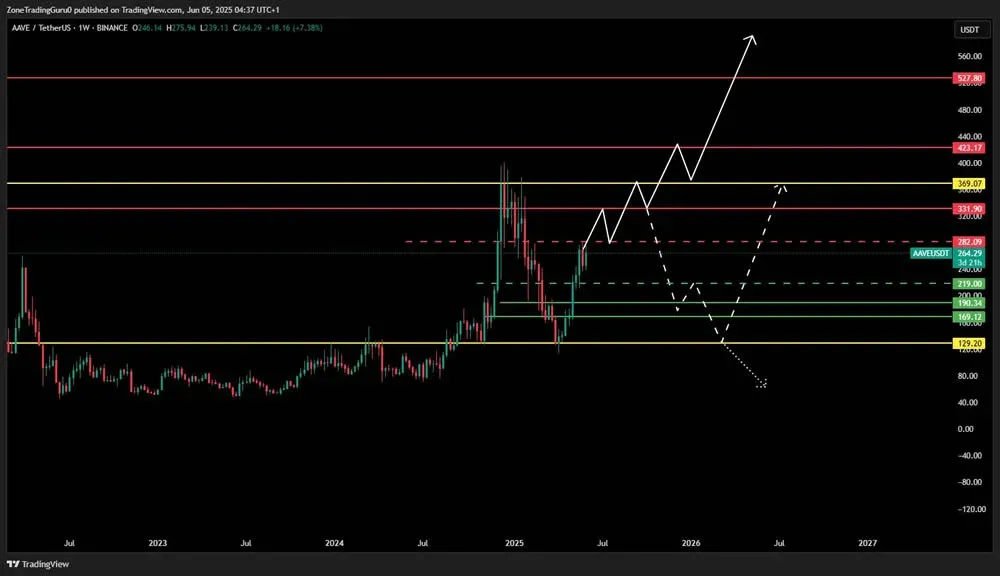
AAVE
AAVE is displaying a sustained upward trajectory, with the current target zone set between $331.90 ~ $369.07, which marks the previous high range. The $369.07 level acts as a critical breakout point; a weekly close above it could form a “cup‑handle” pattern and propel the price toward $423.17, $527.80, and potentially a new all‑time high. Failure to breach this threshold would likely trigger a corrective swing covering $282.09, $219.00, $190.34, $169.12 and $129.20, the latter serving as the final defensive line. A weekly close below $129.20 would invalidate the bullish structure and could push the asset toward a cycle low.
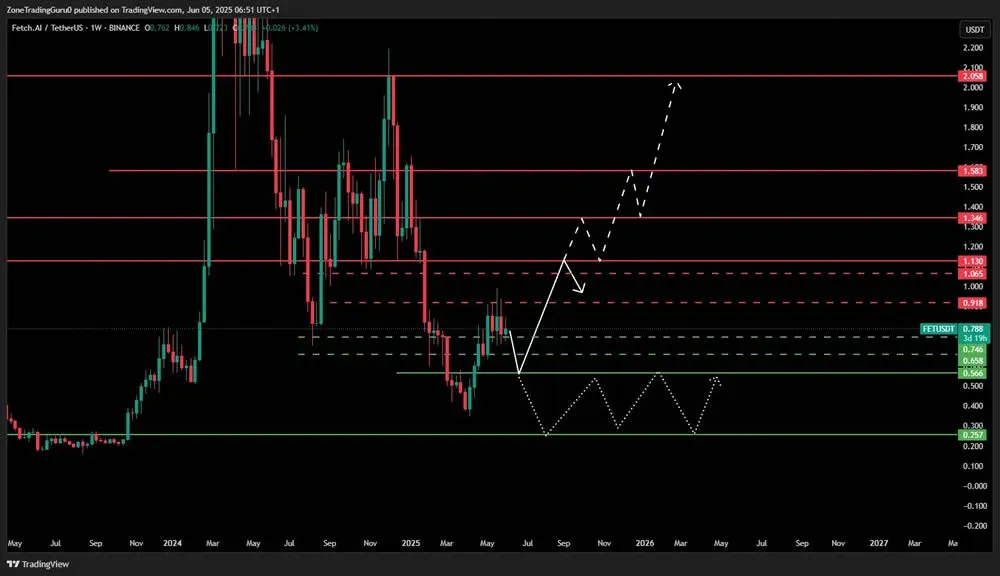
FET
FET is trading within a broad band of $1.13 ~ $0.566. Within this corridor, the levels $1.065, $0.918, $0.746, $0.658 act as various resistance and support points, making them suitable for short‑term scalping. A weekly close above $1.13 would be interpreted as a significant breakout, potentially opening pathways to $1.346, $1.583, and even $2.058. Conversely, a dip below $0.566 could precipitate a retreat toward historic lows, with a new consolidation likely forming between $0.566 ~ $0.257.
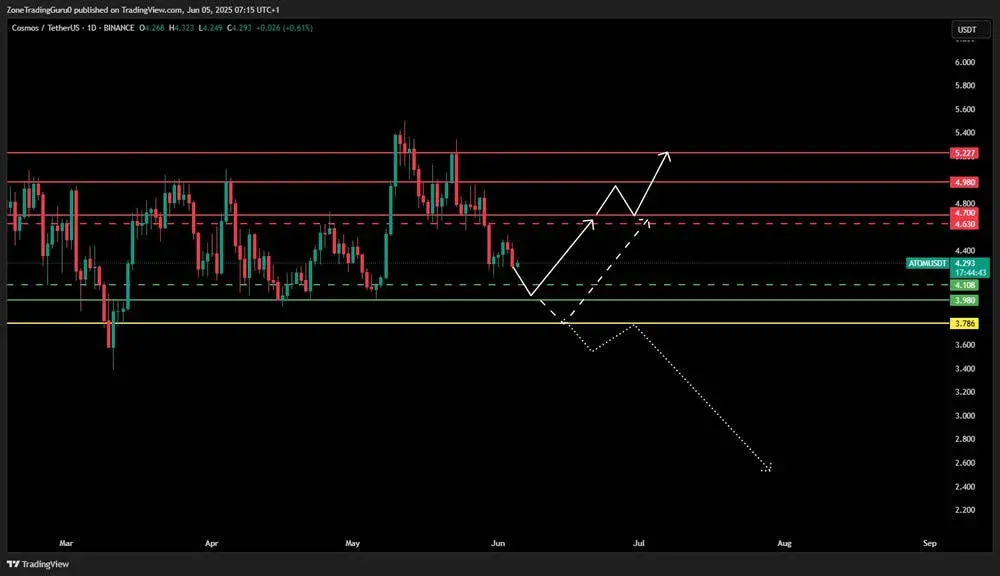
ATOM
ATOM has exhibited a short‑term downtrend, with recent price action possibly testing a bottom range of $4.108 ~ $3.98, and even reaching the weekly support at $3.786. A weekly candle closing below $3.786 would increase the likelihood of breaking earlier lows. If the support holds, the price could rebound to the $4.63 ~ $4.70 zone; a daily close breaking $4.70 may trigger a bullish swing, targeting $4.98 and $5.227 respectively.
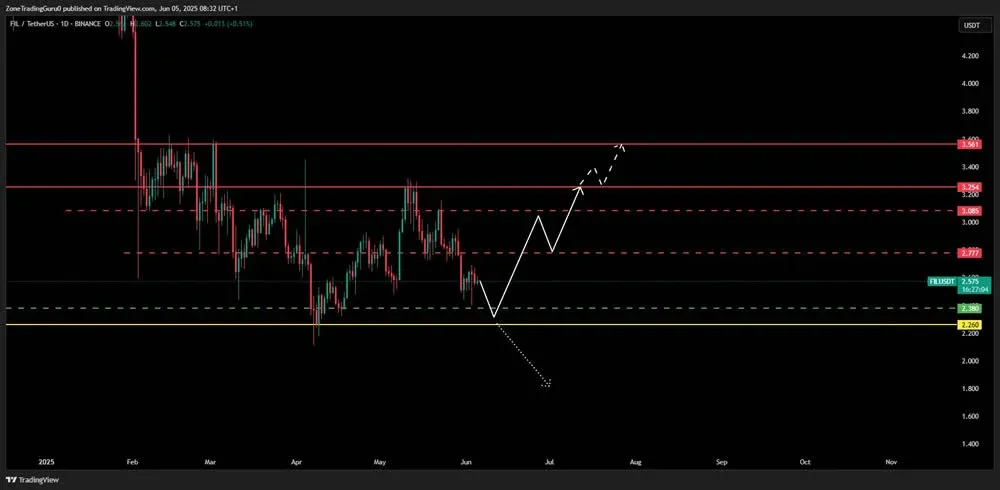
FIL
FIL remains entrenched in a clear downtrend channel, with short‑term pressure likely to drive the price toward the critical support band of $2.38 ~ $2.26. The $2.26 level is especially decisive; a daily close beneath it could establish a new cycle low. Should a rebound emerge from this zone, the first set of resistance levels would be $2.777, $3.085, $3.254. Maintaining daily closes above $3.254 could extend bullish momentum toward $3.561 or higher.
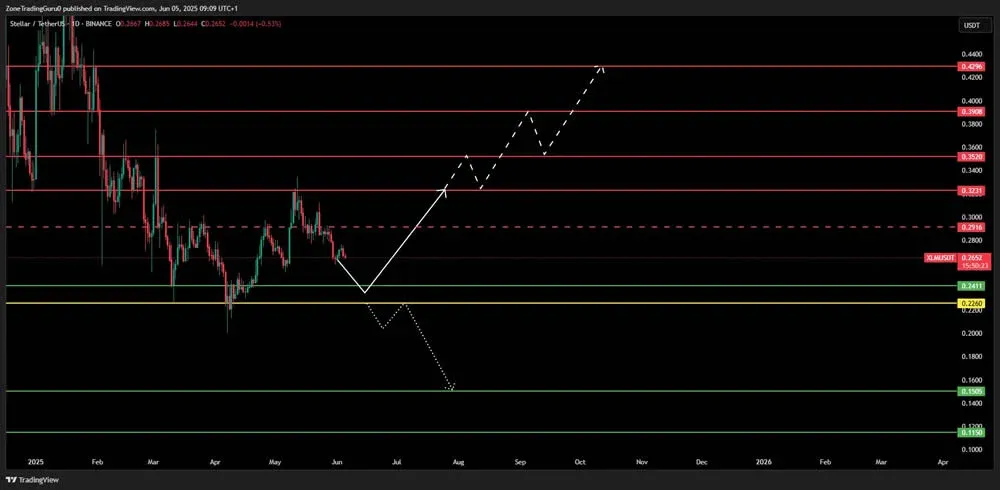
XLM
XLM appears to be entering a corrective phase, with primary support located between $0.2411 ~ $0.2260. A weekly close beneath this band could drive the token deeper, potentially testing $0.1505 ~ $0.1150. Conversely, a strong rebound within the $0.2411 ~ $0.2260 range would lift resistance to $0.2916 ~ $0.3231. A daily close breaking $0.3231 would confirm a bullish reversal, with subsequent targets set at $0.3520, $0.3908, and $0.4296.
---
Closing Remarks
Against the backdrop of Bitcoin’s sideways consolidation, altcoins are converging on multiple technical inflection points. Traders should closely monitor how each token closes relative to its significant support and resistance zones, and always corroborate signals across multiple time frames. Maintaining rigorous trading discipline is essential for seizing opportunities amid a volatile market environment.
The above constitutes the June 9 price forecast for BTC, HBAR, AAVE, FET, ATOM, FIL, and XLM. For additional token price predictions, feel free to explore other articles published by Bitaigen.
*Note: Cryptocurrency gains may be subject to tax in your jurisdiction; please consult a qualified tax professional to understand your obligations.*
Related Reading
- Understanding Bitcoin's Lightning Network: A Layer 2 Scaling Solution
- XRP $2.00 Support Level: Analysis & Potential Moves
- Bonk Price Forecast: Technical Analysis & Market Outlook
💡 Register on Binance with referral code B2345 for the maximum trading fee discount. See Binance complete guide.
⚠️ Risk Disclaimer: Crypto prices are highly volatile. This is not investment advice.


