

We analyze Ethereum from multiple dimensions—technical patterns, on‑chain fund flows, and cost‑basis differentials—to help readers gauge the true strength of the key resistance level this month and to assess possible pull‑back paths if major support is breached. The full article includes data charts and risk warnings and is worth a careful read.
Key Takeaways
- A price of above $1,800 appears to be the threshold that could prevent a further corrective move.
- Both bearish chart formations and on‑chain metrics point to a more pronounced short‑term pressure if ETH falls below $1,500.
Price Support and Cost‑Basis Heatmap
The cost‑basis heatmap shows a solid buying interest cluster around approximately $1,800. In the past 30 days, roughly 1.23 million ETH were purchased at an average cost of $1,890, creating a noticeable cost stack.
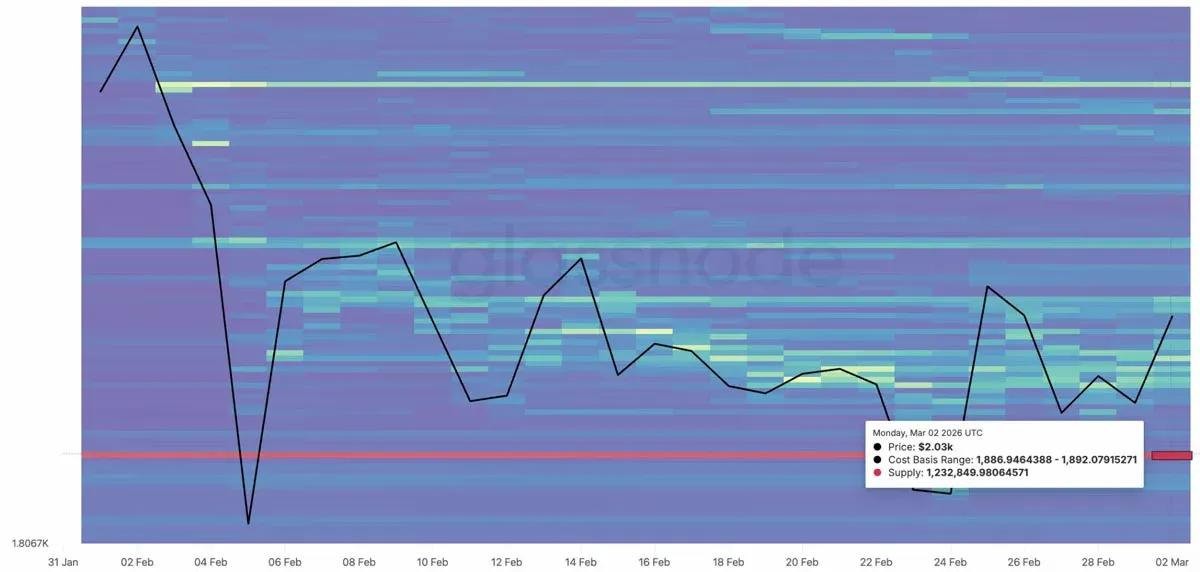
Cost‑Basis Distribution Heatmap
If this level is broken, ETH could retest the February trough.
CoinGlass data indicate that short‑position liquidations over the past two days have exceeded $120 million, mainly targeting leveraged positions. At the same time, there is $624 million of long‑position liquidation exposure above $1,800, forming a liquidity “pocket” beneath the spot price.
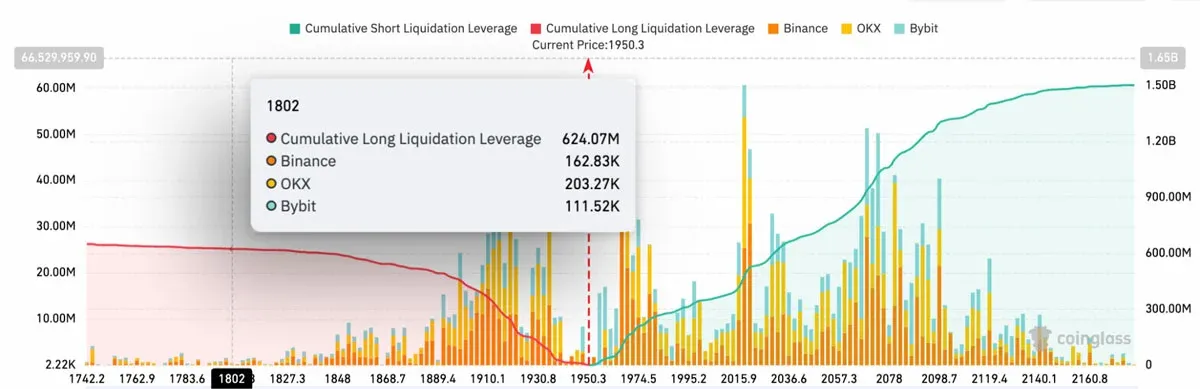
Exchange Liquidation Distribution Chart (source: CoinGlass)
CryptoQuant analyst Maartunn found that about 67,000 ETH (roughly $130 million) sit below the spot price, further underscoring the importance of the $1,800 support zone.
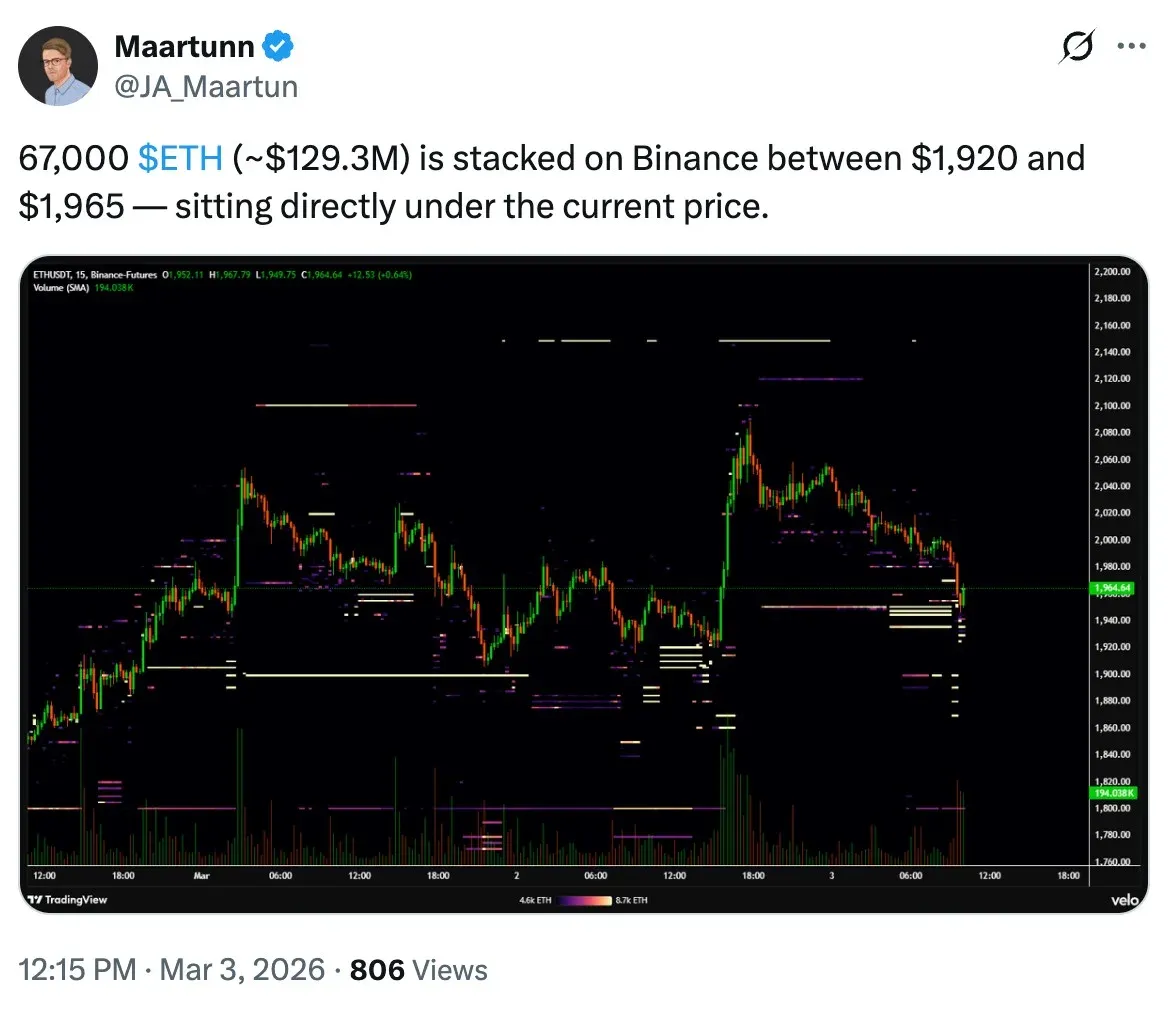
Liquidation Heatmap (source: X/Maartunn)
Technical Pattern and Downside Outlook
On the daily chart, the $1,800‑$1,900 support band aligns with the lower boundary of a symmetric triangle. Should bearish pressure persist, ETH/USD may break below the triangle’s lower trendline at $1,850, potentially testing the multi‑year low of $1,750 that was established on February 6.
If that level is breached, the price could move toward the triangle’s measured target of $1,400, which is about 28 % lower than the current price.
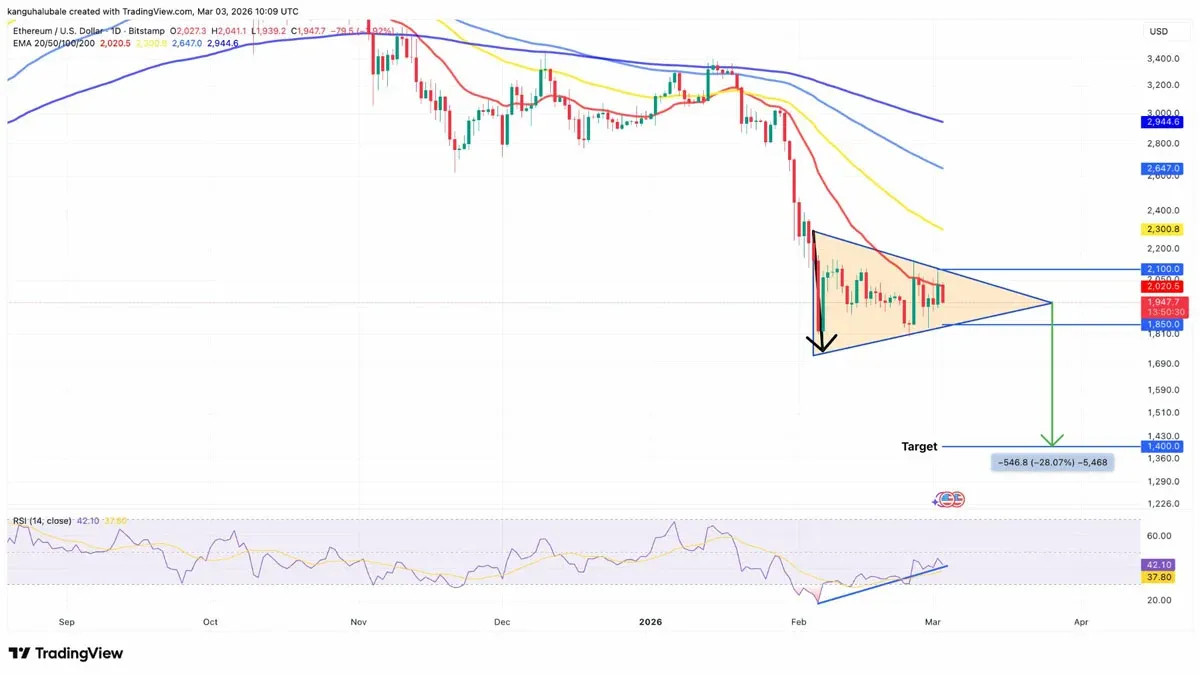
ETH/USD Daily Chart (source: Cointelegraph/TradingView)
Signals from the MVRV Metric
The MVRV extreme‑deviation band still suggests that ETH has room to move lower. Unrealized‑profit holders have not yet reached extreme levels; the metric currently hovers near $1,650.
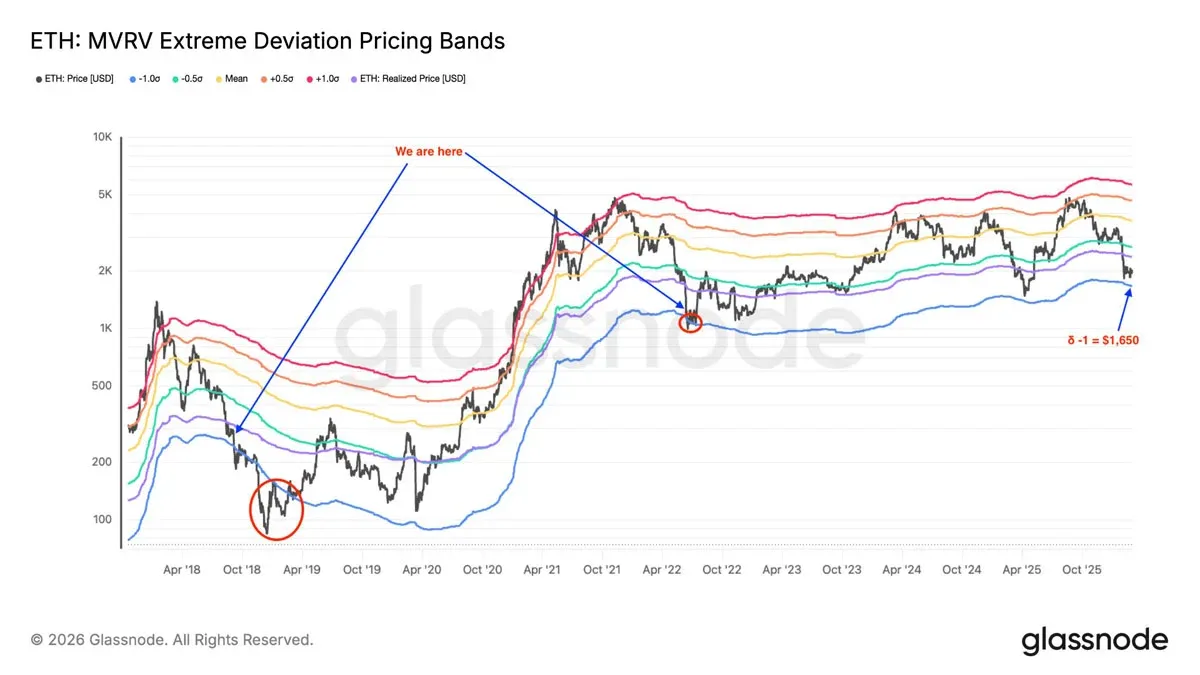
MVRV Extreme Deviation Zone (source: Glassnode)
Historically, during the bear markets of 2018 and 2022, ETH fell below its lowest MVRV zones. Should a similar scenario repeat, the bottom of the current cycle could settle around $1,650, which aligns with the symmetric triangle’s target zone.
Summary
Ethereum encountered resistance again at the $2,000 level. In the short term, a break below $1,800 would likely intensify downside pressure. The convergence of technical patterns, on‑chain cost stacks, and liquidation data points to the $1,500‑$1,650 range as a critical test zone in the coming weeks. For more in‑depth analysis of Ethereum’s March trajectory, stay tuned to Bitaigen’s forthcoming reports.
💡 Register on Binance with referral code B2345 for the maximum trading fee discount. See Binance complete guide.
⚠️ Risk Disclaimer: Crypto prices are highly volatile. This is not investment advice.


