
Ethereum Rebounds to $2,000: Is This the Start of a New Bull Market?
Ethereum, Rebound, Bull Market
Ethereum has demonstrated significant strength recently, surging from the $1,800 level to break through the $2,000 psychological barrier within a 24-hour window. This price action has notably bolstered trader optimism, with many market participants suggesting that reclaiming the $2,000 mark could serve as a pivotal turning point for the current market cycle. However, when examining the broader technical structure, the situation remains intricate and multifaceted.
Despite the recent recovery, ETH has still recorded double-digit losses over the past month and remains a considerable distance from its historical highs near $5,000 reached in previous cycles. The central question now facing the market is whether this volatility represents a genuine bull market breakout or merely a corrective "relief rally" within a larger prevailing downtrend.

As Ethereum aggressively reclaims key psychological thresholds, market sentiment has once again been ignited. However, amidst this optimistic atmosphere, macroeconomic trend signals remain complex. This article provides an in-depth analysis of the drivers behind this rebound, utilizing technical indicators to determine whether the movement constitutes a structural reversal or a short-term correction. Our goal is to provide an objective perspective to help you discern true trends amidst volatility and maintain a rational outlook on subsequent price movements.
Key Takeaways
- Ethereum has successfully reclaimed the $2,000 psychological level following a rapid rebound from the $1,800 support zone.
- Technical indicators suggest a notable improvement in short-term momentum, though a full confirmation of a macro trend reversal has not yet been established.
- Resistance levels between $2,200 and $2,400 are critical for confirming a sustained upward trajectory.
- Global investors should remain aware of local regulations; for instance, US-based users must utilize Binance.US rather than the global Binance platform. Furthermore, it is essential to remember that cryptocurrency gains may be subject to taxation depending on your specific jurisdiction.
Ethereum Price Action: Strong Rebound Within a Broader Context
The recent rally in ETH during 2026 has been primarily fueled by short-term price momentum. The asset climbed nearly 10% within a single day, pushing its total market capitalization toward the $250 billion mark and triggering a significant spike in daily trading volume across global exchanges.
Below is a detailed analysis of Ethereum's recent price structure:
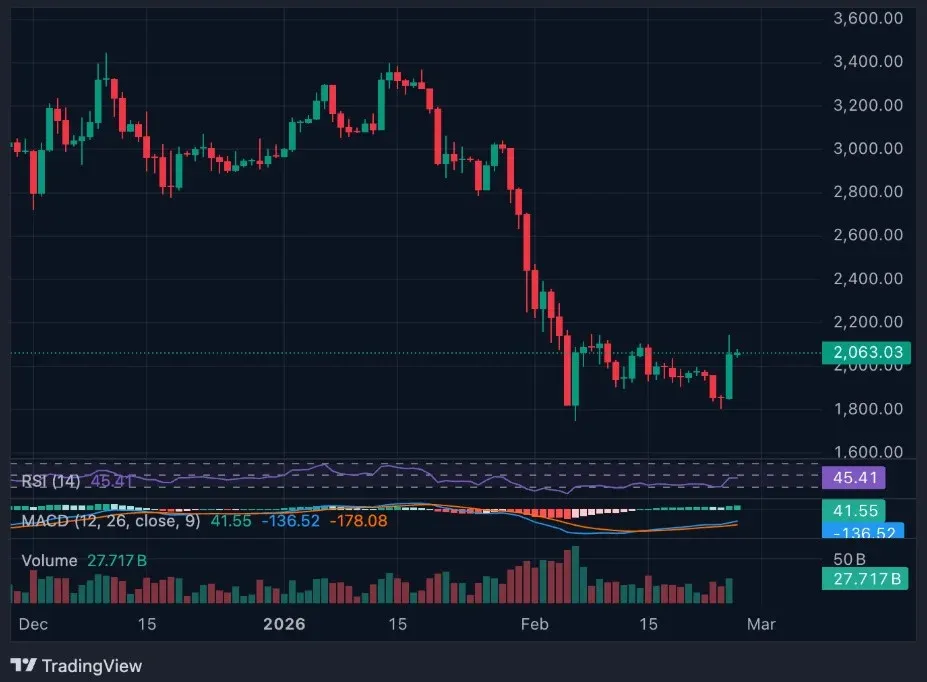
From a technical standpoint, ETH has consistently exhibited a pattern of "lower highs" and "lower lows" since facing rejection near the $3,400 level earlier this year. The previous dip toward $1,800 functioned as a localized "liquidity flush," which subsequently triggered aggressive "buy the dip" behavior from both retail and institutional players.
However, reclaiming $2,000 does not automatically invalidate the broader bearish structure. A true trend reversal requires structural confirmation—such as a series of higher lows—rather than just the recovery of a psychological price point.
RSI and MACD Signals: Early Signs of Momentum Shifting
On the daily chart, the Relative Strength Index (RSI) is currently climbing out of the oversold territory and sits near the neutral 40 level. This suggests that the intense selling pressure seen in previous weeks is beginning to subside, although the bulls have not yet seized absolute control of the market.
Simultaneously, the Moving Average Convergence Divergence (MACD) histogram has begun to contract, indicating that bearish momentum is waning. While a bullish crossover would serve as a strong confirmation signal, it remains in a state of uncertainty at this stage.
Momentum indicators currently support the view that Ethereum is in a corrective rebound phase rather than a confirmed trend breakout. Before declaring a formal change in trend, traders typically look for the price to sustain itself above key resistance levels and establish a higher base of support.
Critical Resistance Levels to Watch
For Ethereum to stabilize above $2,000 and evolve into a genuine bull market breakout, it must successfully overcome several key technical hurdles:
- $2,200: This serves as a short-term resistance level and represents a previous breakdown zone.
- $2,400: A significant supply zone characterized by early consolidation phases.
- $2,800: The primary structural resistance; a breakout above this level would effectively invalidate the overall downward trend.
Failure to breach the $2,200 mark could lead to renewed selling pressure. In such a scenario, ETH might retest the $1,900 or even the $1,800 support levels. Currently, the $2,000 region has transitioned into immediate support. Sustained trading above this level will reinforce bullish sentiment; conversely, a drop below it would significantly weaken the recovery narrative.
Trading Volume and Market Participation
The rebound has been accompanied by a noticeable increase in trading volume, which is generally viewed as a positive signal. Breakouts supported by high volume typically possess better sustainability than those on low volume.
However, aggregate market data indicates that overall liquidity in the cryptocurrency market remains relatively fragile. Bitcoin's market dominance remains high, suggesting that capital has not yet rotated on a massive scale into Ethereum or other altcoins.
Ethereum's technical trajectory will remain highly dependent on the broader market environment. If Bitcoin can stabilize or continue its ascent, Ether is likely to perform well in the short term. Conversely, any macroeconomic weakness could quickly erase these recent gains.
Macroeconomic and Sentiment Factors
Ethereum does not trade in a vacuum. Macroeconomic uncertainties, discussions surrounding global trade tariffs, and ongoing geopolitical tensions continue to exert influence on the crypto markets.
In 2026, market risk appetite has remained volatile, and institutional participation remains highly selective. Without consistent capital inflows via channels like SEPA or SWIFT for fiat-to-crypto onramps, the momentum of this rebound could gradually dissipate. Sentiment indicators currently reflect "cautious optimism" rather than "extreme euphoria," which is often healthy during the early stages of a recovery, though sentiment alone is insufficient to sustain a long-term bull market.
Is This the Beginning of a New Uptrend?
To confirm the start of a new sustained upward trend, Ethereum must demonstrate the following:
- The formation of a "higher high" above the $2,400 level.
- Strong consolidation and price floor establishment at reclaimed levels.
- Continued improvement in on-chain activity and derivatives open interest.
At present, ETH price analysis suggests this is more of an early-stage recovery attempt rather than a confirmed macro reversal. Historically, Ethereum rebounds often begin with a sharp short squeeze followed by a period of consolidation. If a "higher low" pattern forms in the coming weeks, the bullish outlook will be significantly strengthened.
Bull vs. Bear Scenario Analysis
The Bullish Scenario
If Ethereum can maintain its $2,000 support and clearly break above $2,200, momentum traders may push the price toward the $2,400–$2,600 range. A further breakout above $2,800 would confirm a structural reversal and potentially pave the way toward $3,200. This movement would likely require a stable macro environment and increased institutional demand.
The Bearish Scenario
If the current move is merely a temporary bounce, the price may face rejection near $2,200. A drop back below $1,900 would put the $1,800 support at risk once again. Losing that support could lead to an accelerated decline toward deeper liquidity zones. Given the potentially subdued overall market sentiment, this scenario remains a possibility.
Long-Term Outlook
Despite short-term uncertainties, Ethereum's long-term fundamentals remain robust. The network continues to dominate the sectors of smart contracts, Decentralized Finance (DeFi) applications, and the burgeoning field of real-world asset tokenization.
However, price cycle shifts are influenced as much by liquidity and macro dynamics as they are by fundamentals. Traders should distinguish between long-term conviction and short-term volatility. While reclaiming $2,000 is technically significant, final confirmation of a trend shift requires patient observation.
Conclusion
Ethereum’s return to the $2,000 level is an important psychological milestone. Momentum indicators are stabilizing, and short-term market sentiment has improved.
However, the primary trend has not yet fully reversed. Multiple layers of resistance lie ahead, and the market must demonstrate sustained buying power to declare a new uptrend. Currently, Ethereum is in a critical phase of attempting a reversal; the bulls must prove their ability to defend $2,000 and challenge higher resistance zones.
Frequently Asked Questions (FAQ)
Why did the Ethereum price break above $2,000?
The breakout was triggered by an oversold condition near $1,800, combined with a surge in short-term buying pressure and improving technical momentum indicators.
Does reclaiming $2,000 confirm a bullish reversal?
Not yet. While $2,000 is psychologically significant, the technical structure still shows ETH under broader downward pressure. Stronger confirmation signals are needed.
Which resistance levels are critical for further gains?
Key resistance levels to watch include $2,200, $2,400, and $2,800. Breaking these levels would significantly increase the credibility of a sustained uptrend.
Is this a confirmed bullish breakout for ETH?
It cannot yet be classified as a macro breakout. ETH must overcome higher resistance levels, such as $2,200 and $2,400, to establish a definitive upward trajectory.
What happens if Ethereum falls below $2,000 again?
Falling back below $2,000 would likely dampen current bullish momentum and increase the probability of the price retesting the $1,800 support zone.
💡 Register on Binance with referral code B2345 for the maximum trading fee discount. See Binance complete guide.


