
We examine the price drivers for silver from three major dimensions—macroeconomic monetary policy, supply tightness, and industrial demand—looking ahead to 2026 and beyond. By dissecting the sentiment indicated by the gold‑to‑silver ratio and providing an in‑depth read of key industrial silver usage trends, we help readers assess whether silver still holds investment merit. For the details, continue reading this article.
Potential Macroeconomic Tailwinds for Silver in 2026
Before 2026 arrives, global monetary policy has already entered a relatively sluggish phase. While many markets are still watching to see whether the Federal Reserve will continue cutting rates, most analysts now view the upward trend in rates as “gradually slowing.” According to a consensus forecast from Reuters and Bloomberg at the end of 2025, real global interest rates in 2026 are expected to remain in a relatively accommodative band, which underpins precious metals overall, and silver—because of its industrial character—should receive an additional boost on this foundation.
At the same time, silver’s supply elasticity remains constrained. The Silver Institute reports that in 2025 the world experienced an approximate 149 million‑ounce (Moz) supply shortfall, and that 2026 is projected to fluctuate between 63 – 117 Moz. Because roughly 70 % of silver is a by‑product of copper, lead, zinc and other base‑metal mining, production growth depends more on the extraction pace of those primary metals than on silver’s own price signals. Inventory data show that deliverable stocks on the LBMA and COMEX have fallen to multi‑year lows, indicating that structural tightness on the supply side is persisting.
On the demand side, sectors such as photovoltaics, electric vehicles, semiconductors, and AI data centers continue to record solid silver consumption growth. While these demand streams alone are unlikely to trigger a dramatic price surge, they provide a sturdy floor for silver. When the fundamentals of industrial demand coincide with buying pressure from financial capital, price often embarks on a noticeable upward move.
The gold‑to‑silver ratio remains a key sentiment barometer. At the end of 2025 the ratio stood around 66:1, having gradually reclaimed ground from a previous 80:1+ level. Historically the ratio has oscillated between 60‑75:1, dipping to 30:1 during the 2011 bull market. If gold holds near $4,200 per ounce in 2026, a further narrowing of the ratio would give silver a significant leverage effect:
- Conservative scenario (gold‑to‑silver 60:1): Silver around $70
- Aggressive scenario (gold‑to‑silver 40:1): Silver around $105
As long as gold trades in a high‑range band, any substantive decline in the ratio could amplify silver’s short‑term gains.
Technical Overview of Silver
The monthly chart from 1980 to the present reveals a 45‑year “cup‑with‑handle” formation for silver. Historically, the $49.5‑$50 peak appeared in 1980 and again in 2011, and has long been regarded as a resistance zone. By the end of 2025, silver not only broke the $50 threshold but also consolidated above it, turning that level into a long‑term support point.
Silver is currently hovering around $71, entering a price‑discovery phase. After breaking $70, there is little obvious historical resistance above, and short‑term sentiment shows a clear FOMO (fear‑of‑missing‑out) component. Provided the monthly structure remains intact, the move can still be viewed as a continuation of the bullish trend rather than a sign of decay.
From a technical standpoint, two potential pull‑back zones merit attention:
- $65‑$68 – a dense成交 (volume) area formed after the recent breakout; if the market stays healthy, a retest could attract fresh buying.
- $55‑$60 – a deeper, longer‑term structural support; a breach would require a reassessment of the bullish narrative’s validity.
Inventory dynamics remain a crucial indicator where technical and fundamental factors intersect. Should deliverable stocks continue to drain in Q1 2026, physical‑market tightness would intensify, making a short‑cover (short‑squeeze) scenario plausible rather than far‑fetched.
Main Risk Factors for Silver Investment
- Short‑term overheating: Momentum indicators such as RSI have lingered above 70 for an extended period; during holidays or periods of thin liquidity, the market is prone to rapid corrections. Such pull‑backs tend to be swift but do not necessarily signal a trend reversal.
- Abrupt macro policy shift: If the Fed pivots hawkishly or the global economy suffers a hard landing, industrial demand expectations would be repriced, potentially nudging silver back into the $60‑$65 corridor.
- Rapid sentiment reversal: In a price‑discovery stage, leveraged capital tends to increase; a sharp decline could trigger stop‑loss orders and forced liquidations, leading to a cascading price drop.
- Industrial demand slowdown: A pronounced drop in manufacturing output—especially in China and Europe—or a shortfall in green‑energy investment could shave 5‑10 % off silver’s industrial demand. Heraeus reports a 14 % decline in India’s jewelry and silverware imports.
- Supply‑side surprise improvement: Although the past five years have been characterized by a supply‑demand deficit, high prices might incentivize mine re‑activation or increased recycling. Should supply rebound significantly after 2026, the structural bull market could end earlier than expected.
Silver Investment Vehicles and Practical Guidance
1. Physical Silver
- Pros: Tangible asset with no counter‑party risk; can act as “hard cash” during extreme financial crises; possesses inter‑generational store‑of‑value qualities.
- Cons: Purchasers typically incur a 20 %‑30 % premium over spot; liquidity is relatively poor and liquidation may involve a discount; storage and insurance fees are unavoidable.
- Who it suits: Highly risk‑averse individuals, long‑term value preservers, and investors seeking a “ballast” component in their portfolio.
- Tip: Use reputable channels (banks, well‑known mints, or large‑scale dealers), monitor the premium level, and arrange secure storage in advance.
2. Silver ETFs (e.g., SLV)
- Pros: High liquidity; can be bought or sold on exchanges at any time; eliminates the hassle of physical storage and insurance; suitable for inclusion in tax‑advantaged retirement accounts such as IRAs or 401(k)s (or their international equivalents). Net asset value closely tracks spot silver.
- Cons: Annual management fee (SLV≈0.50 %); investors hold fund shares rather than direct ownership of the metal; fund‑operation risk persists, especially in extreme market stress; physical redemption is generally unavailable.
- Who it suits: Investors who prioritize convenience, liquidity, and ease of trading, particularly those holding retirement accounts.
- Tip: Prefer ETFs with large assets under management and deep liquidity, understand the fee structure, and recognize that the objective is price tracking rather than acquiring physical silver. *Note: In many jurisdictions, gains realized from ETF sales are subject to capital‑gains tax, so consult local tax rules.*
3. Contracts for Difference (CFDs)
- Pros: No need to pay the physical‑silver premium; traders profit from pure price differentials; enables both long and short positions; high leverage can amplify returns from volatility; can be used to hedge physical or long‑only exposure.
- Cons: Leverage magnifies risk and can lead to losses exceeding the initial margin; traders must bear spread costs and overnight financing charges; requires a high degree of analytical skill and risk‑management discipline.
- Who it suits: Experienced short‑term traders, speculators, and professional investors who need two‑way exposure for hedging purposes.
- Tip: Rigorously employ stop‑loss orders, limit position size per trade, fully understand the leverage mechanism, and define clear entry/exit rules (e.g., consider shorting near $75, then buying back on a pull‑back to $65‑$68).
Fiat settlement: For investors needing to fund purchases with fiat currency, SEPA transfers (for Euro‑zone participants) and SWIFT wires (global) are the standard settlement methods. U.S. residents should use Binance.US for any crypto‑related transactions, while other jurisdictions may access the global Binance platform.
Silver Price Forecast Summary (2026‑2030)
2026
- InvestingHaven expects silver to consolidate near the $50 range.
- CoinPriceForecast projects an end‑of‑year price around $50.
- LongForecast.com gives a monthly swing band of $31.08‑$49.90.
- Dukascopy argues that inflation and industrial demand could lift prices to $30‑$35, with a weaker dollar potentially pushing them higher.
- LiteFinance forecasts year‑end levels between $34.21‑$43.04, with an optimistic ceiling of $69.57.
| Month | Low | High |
|------|------|------|
| Jan | $39.38 | $43.52 |
| Feb | $36.94 | $41.45 |
| Mar | $36.82 | $40.70 |
| Apr | $38.76 | $43.22 |
| May | $37.67 | $41.63 |
| Jun | $35.33 | $39.65 |
| Jul | $36.94 | $40.82 |
| Aug | $38.88 | $43.35 |
| Sep | $36.79 | $41.29 |
| Oct | $36.25 | $40.07 |
| Nov | $38.16 | $42.56 |
| Dec | $40.53 | $45.19 |
2027
- Market consensus anticipates a relatively stable volatility band, with a February peak near $45.96 and a July trough around $36.09. Overall demand remains underpinned by macro uncertainties.
| Month | Low | High |
|------|------|------|
| Jan | $41.12 | $45.44 |
| Feb | $43.28 | $48.26 |
| Mar | $40.95 | $45.96 |
| Apr | $41.14 | $45.47 |
| May | $38.66 | $43.30 |
| Jun | $36.56 | $40.69 |
| Jul | $34.29 | $38.48 |
| Aug | $34.93 | $38.61 |
| Sep | $36.77 | $41.00 |
| Oct | $35.69 | $39.45 |
| Nov | $36.58 | $40.43 |
| Dec | $34.77 | $38.50 |
2028
- LongForecast predicts a start‑of‑year price of $36.60, a mid‑year dip to $31.26‑$33.20, and a year‑end rebound to $33.86.
| Month | Low | High |
|------|------|------|
| Jan | $36.60 | $40.81 |
| Feb | $34.69 | $38.87 |
| Mar | $32.55 | $36.52 |
| Apr | $31.66 | $35.00 |
| May | $29.70 | $33.33 |
| Jun | $31.26 | $34.86 |
| Jul | $33.20 | $37.02 |
| Aug | $31.42 | $35.26 |
| Sep | $31.00 | $34.26 |
| Oct | $31.63 | $34.95 |
| Nov | $33.29 | $37.12 |
| Dec | $32.17 | $35.55 |
2029
- Coin Price Forecast envisions a range of $67‑$69.88; DigitalCoinPrice is markedly bullish, projecting highs up to $166.75; Dukascopy stays more conservative at $34‑$42.
| Month | WalletInvestor Range | DigitalCoinPrice Range |
|------|----------------------|------------------------|
| Jan | $37.15‑$37.62 | $146.52‑$166.15 |
| Feb | $37.60‑$38.27 | $146.67‑$163.20 |
| Mar | $38.26‑$38.44 | $147.63‑$160.25 |
| Apr | $38.56‑$38.98 | $147.65‑$166.25 |
| May | $38.18‑$38.54 | $146.97‑$170.45 |
| Jun | $37.94‑$38.53 | $147.91‑$169.15 |
| Jul | $37.99‑$38.64 | $146.62‑$153.66 |
| Aug | $38.59‑$39.18 | $146.39‑$154.52 |
| Sep | $38.58‑$39.37 | $147.45‑$155.47 |
| Oct | $38.43‑$38.92 | $146.77‑$154.69 |
| Nov | $38.67‑$38.91 | $147.16‑$166.30 |
| Dec | — | $147.20‑$164.06 |
2030
- WalletInvestor expects the whole year to oscillate between $39‑$41; DigitalCoinPrice forecasts a broader $166‑$190 band, with a potential peak in May.
| Month | WalletInvestor Range | DigitalCoinPrice Range |
|------|----------------------|------------------------|
| Jan | $39.15‑$39.62 | $166.52‑$186.15 |
| Feb | $39.60‑$40.27 | $166.67‑$183.20 |
| Mar | $40.26‑$40.44 | $167.63‑$180.25 |
| Apr | $40.56‑$40.98 | $167.65‑$186.25 |
| May | $40.18‑$40.54 | $166.97‑$190.45 |
| Jun | $39.94‑$40.53 | $167.91‑$189.15 |
| Jul | $39.99‑$40.64 | $166.62‑$173.66 |
| Aug | $40.59‑$41.18 | $166.39‑$174.52 |
| Sep | $40.58‑$41.37 | $167.45‑$175.47 |
| Oct | $40.43‑$40.92 | $166.77‑$174.69 |
| Nov | $40.67‑$40.91 | $167.16‑$186.30 |
| Dec | — | $167.20‑$184.06 |
Long‑Term Charts and Historical Review
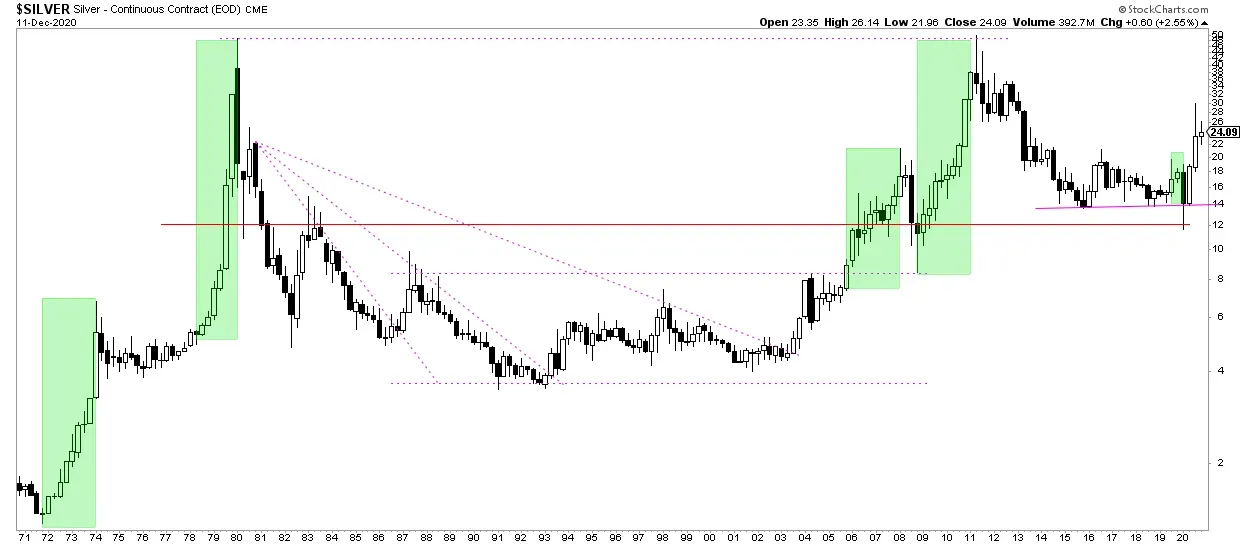
From 1980 to the present, silver has undergone multiple episodes of intense volatility: early climbs above $36 per ounce were followed by a plunge below the $10 mark. The 2011 bull market pushed the price close to $50. In recent years, central‑bank policies, interest‑rate trajectories, and market sentiment have collectively shaped silver’s price dynamics.
Key Drivers Behind Silver Price Forecasts
- Investment demand: Changes in ETF holdings, physical purchases, and speculative positions serve as vital windows into market sentiment. Rising demand often signals upward price potential.
- Gold‑to‑silver ratio: Historically, a higher ratio has coincided with relatively stronger silver performance; a declining ratio may hint at silver’s relative strength.
- Inflation expectations: When investors anticipate higher inflation, they frequently turn to silver as a hedge
💡 Register on Binance with referral code B2345 for the maximum trading fee discount. See Binance complete guide.
⚠️ Risk Disclaimer: Crypto prices are highly volatile. This is not investment advice.


