
 Bitaigen Research
 From the perspectives of regulation, fees, liquidity, and the DeFi ecosystem, we systematically outline the fundamental differences between Ethereum ETFs and Bitcoin ETFs, dissect the premium risk of Grayscale, listing thresholds, and demand proxies. By comparing the operating models of the two fund types, we help readers capture market signals. Subsequent sections will provide deeper analysis, so stay tuned.
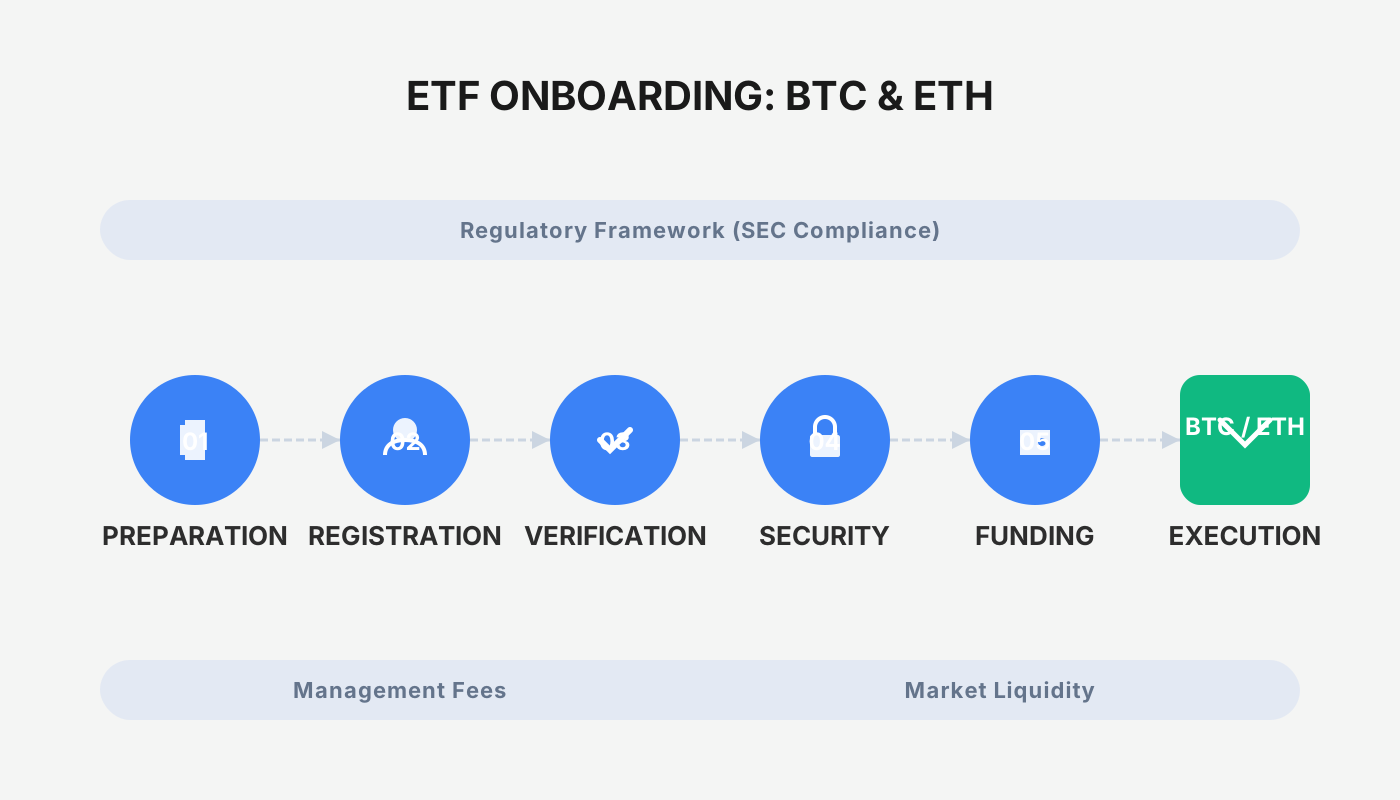
What Are the Differences Between an Ethereum ETF and a Bitcoin ETF?
The primary distinctions between Ethereum ETFs and Bitcoin ETFs lie in the underlying assets, regulatory requirements, fee structures, sources of liquidity, and the impact on the DeFi ecosystem, with ETH’s staking ratio being markedly higher than that of BTC.
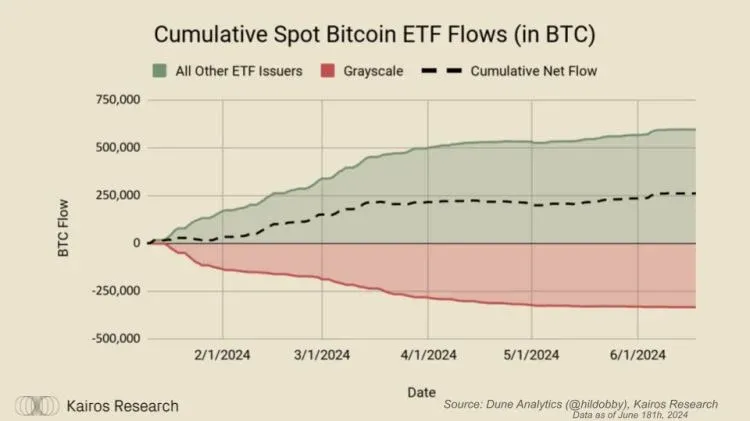
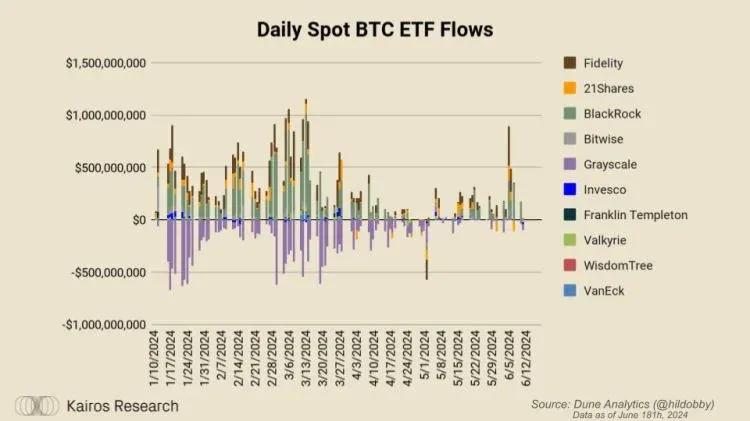
In the past year, Bitcoin ETFs have performed spectacularly, attracting a cumulative net inflow of roughly $15 billion, involving about 260,000 BTC. Since the launch of 11 products in January, total trading volume has already surpassed $300 billion. By contrast, Ethereum ETFs are now entering their “highlight moment.” This article examines the two fund types across four dimensions and explores possible ecosystem effects:
- Grayscale’s concerns about premium/discount risk
- Listing conditions that differ from BTC
- Demand proxies
- Impact on DeFi
Grayscale’s Concerns About Premium/Discount Risk
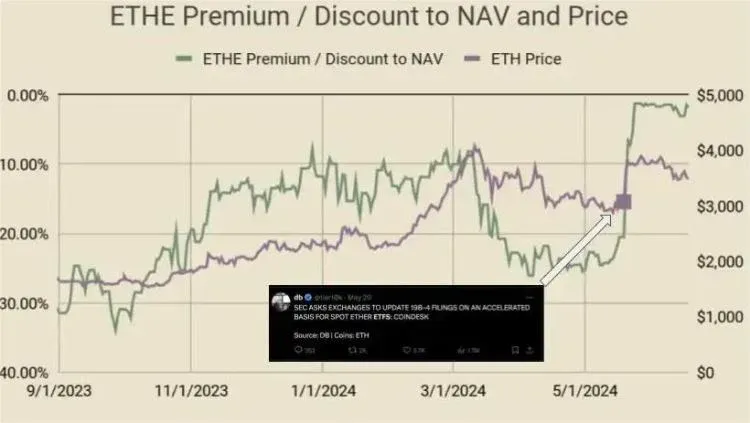
Multiple parties have previously highlighted the discount‑trading risk of ETHE (the Grayscale Ethereum Trust). At one point, ETHE traded at ‑56 % relative to its Net Asset Value (NAV), indicating a substantial discount. If the GBTC model were applied, management fees could translate into a fee rate higher than competing products. Currently, ETHE’s management fee stands at 2.5 %, whereas Van Eck and Franklin Templeton charge roughly 20 basis points, and other issuers are expected to maintain similar levels.
We anticipate the main drivers for selling to include:
- Selling pressure due to relatively high fees
- Arbitrage opportunities that buy at a discount and capture the price spread
Although Grayscale holds a large amount of ETHE, the overall flow remains net positive, both in USD and BTC.
Listing Conditions Different From BTC
Bitcoin ETFs have been hailed as one of the most anticipated products in history. After Grayscale’s breakthrough ruling against the SEC on August 29, 2023, GBTC briefly surged 30 %, then gradually reverted to its true NAV. Despite misinformation spreading during that period (e.g., a false report by a Cointelegraph intern and a hacking incident involving the SEC’s official account), the Bitcoin ETF received formal approval on January 10, 2024, giving all participants ample preparation time.
In contrast, the rollout of an Ethereum ETF has been more compressed. Up until March 20, 2024, market discussion was minimal; on that same day, Bloomberg analysts raised the approval probability from 25 % to 75 %. The SEC promptly instructed exchanges to get ready for a spot Ethereum ETF, causing ETHE’s price to spike. Three days later the fund was officially approved and quickly settled near its NAV.
This indicates that:
- Bitcoin ETFs benefited from extensive media exposure and early‑stage investor education opportunities.
- Ethereum ETFs faced a shorter listing window, requiring issuers to complete investor education within a tighter timeframe.
Consequently, the speed of capital inflow into an Ethereum ETF may be influenced by education costs and could also experience a “spill‑over effect” from the success of Bitcoin ETFs.
Demand Proxies
Although some commentators argue that demand for an ETH ETF is limited, data shows that U.S. investors’ interest in ETH continues to rise. For example:
- Coinbase holds more than 1.4 million ETH (approximately $4.75 billion).
- Kraken, Robinhood, and Gemini collectively possess over 1.2 million ETH, surpassing the combined holdings of OKX, UpBit, Bybit, BitThumb, and Crypto.com.
- According to ethernodes.org, roughly 34 % of Ethereum nodes are located in the United States.
These figures suggest that the U.S. market already exhibits strong demand for ETH, and the launch of a spot ETH ETF is likely to reinforce this trend.
Impact on DeFi
From a medium‑ to long‑term perspective, an Ethereum ETF could profoundly affect the overall supply of ETH. As @rewkang noted, ETH lacks “structural buyers” comparable to BTC (e.g., Michael Saylor, Tether, large whales), yet its supply dynamics display distinctive shifts:
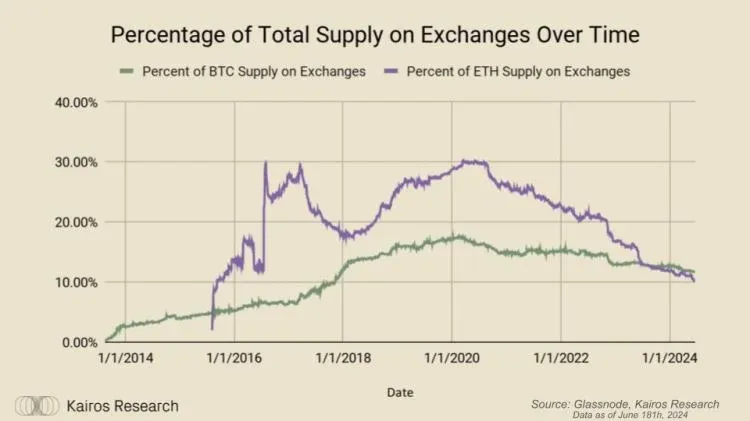
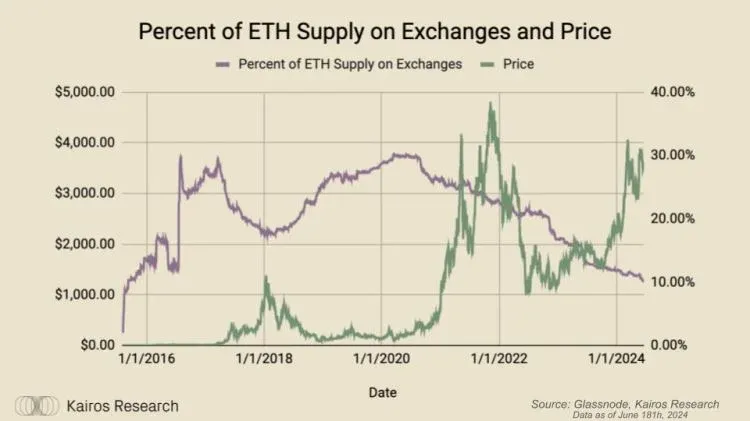
- The proportion of ETH held on exchanges has been steadily declining, now lower than that of BTC, a trend that aligns with the launch of Uniswap v2 in May 2020.
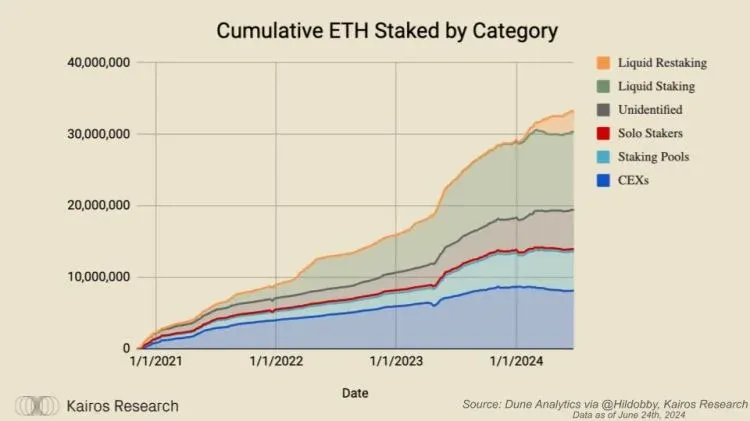
- Staked ETH accounts for 27.57 % of total supply, exceeding the holdings of any single entity of BTC.
- Including assets locked on L2 bridges, wrapped contracts, and other on‑chain mechanisms, the overall locked‑up ratio surpasses 32.33 %.
As DeFi enters its fifth year, liquid‑staking tokens and re‑staking tokens are becoming user preferences. More ETH is expected to migrate from exchanges to staking contracts, further diminishing spot liquidity and enhancing the self‑reinforcing economics of the chain.
Overall, while it is difficult to precisely forecast how many USD‑level inflows an ETH ETF will generate, the structural factors described above are sufficient to help us understand its potential impact on the ETH supply pool and its role in attracting more investors to the on‑chain economy. Remember: price drives usage, usage drives narrative, and narrative in turn steers price. We will continue to monitor how these structured products affect ETH across the entire blockchain ecosystem.
The foregoing constitutes the main differences and in‑depth analysis of Ethereum ETFs versus Bitcoin ETFs. For further updates, follow Bitaigen (比特根)’s future reports.
Related Reading
- Ethereum ETF Final SEC Approval July 2024 Boosts Liquidity
- What Is an Ethereum ETF? A Simple Guide for Investors
- Spot Ethereum ETFs: Issuers & SEC Approval Steps
💡 Register on Binance with referral code B2345 for the maximum trading fee discount. See Binance complete guide.



