
Bitcoin has remained above $67,000 throughout the week, showing almost no signs of panic‑selling. Analysts argue that the market is treating the recent sharp swing in energy prices as a localized shock rather than a fundamental shift in overall risk sentiment.
“If there were still a bubble in Bitcoin, it would have sold off more than 10 % at the opening out of panic,” Brian Brooks‑Hill wrote on X.
He added that Bitcoin’s ability to stay flat while other assets tumble sharply could be a key signal that a bottom is already forming.
At the same time, Nic, founder and CEO of CoinBureau, pointed out that BTC/USD posted its first positive weekly candlestick in seven weeks this week, forming an inverted hammer—a pattern often interpreted as a potential bullish reversal.
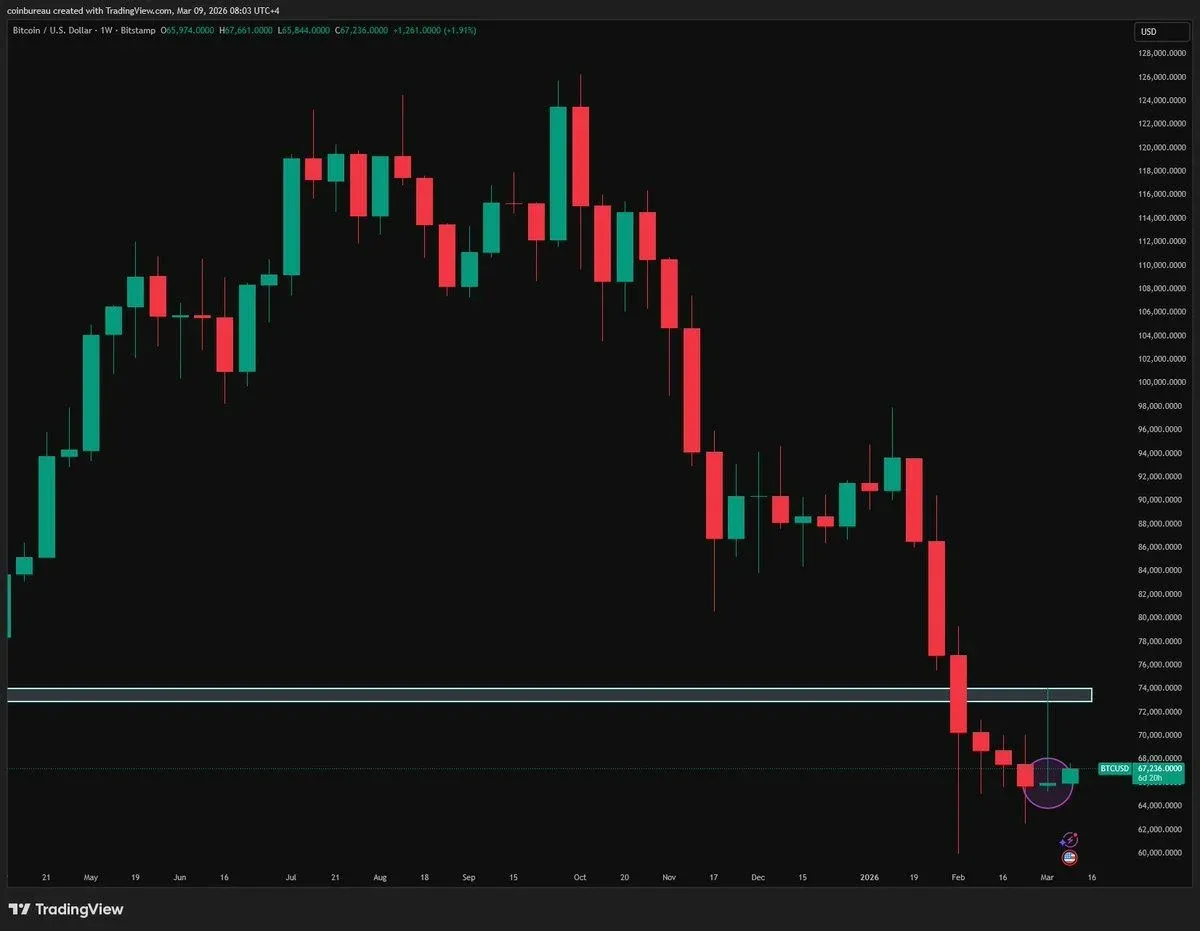
An inverted hammer is characterized by a small real body, a very short lower shadow, and an upper shadow at least twice the length of the body. This suggests that buying pressure is pushing back against sellers and that the trend may turn upward.
If the week is accompanied by increased trading volume, a stronger bullish candle that breaks resistance could allow Bitcoin to continue its upward trajectory.
---
We have observed that the recent turbulence in oil prices is shaking financial markets, yet Bitcoin remains resilient at a critical juncture. By analyzing the technical inverted‑hammer pattern and the weekly price action, this article outlines multiple signals pointing to a Bitcoin bottom, helping readers assess whether a new support level has emerged. The analysis is worth a thorough read.
Behind the Surge in Oil Prices
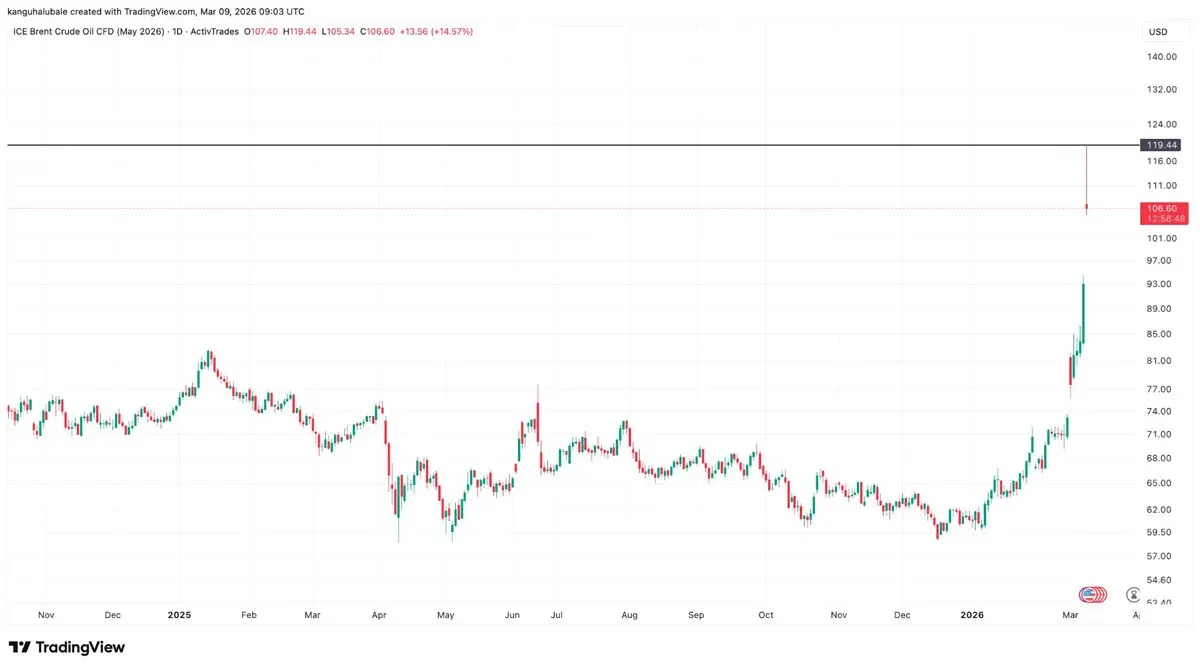
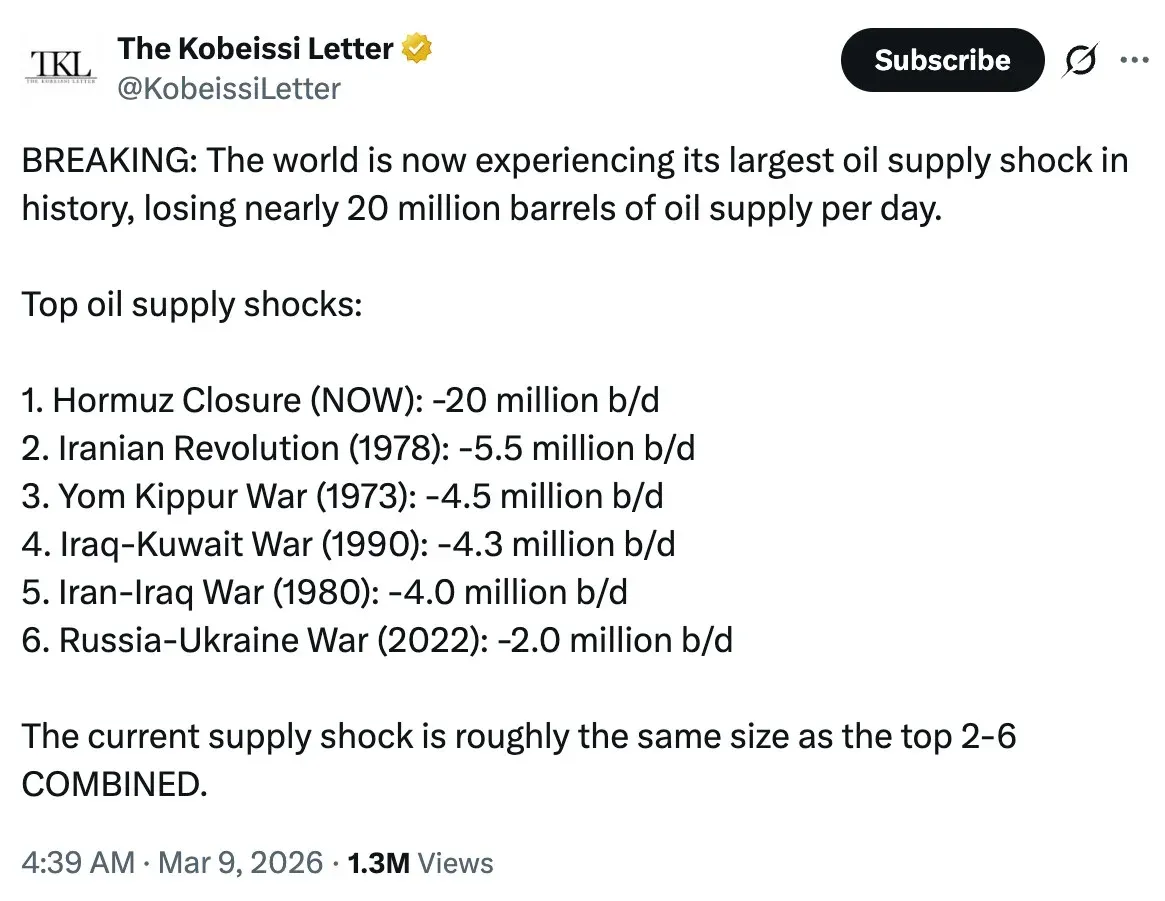
Escalating tensions in the Middle East have driven oil prices as high as $119 per barrel during Asian morning trading this week—the highest level since Russia’s invasion of Ukraine in 2022. Iraqi officials have warned that Iranian threats to tanker traffic in the Strait of Hormuz could interrupt approximately 3 million barrels per day of production.
Commentators at KobeX described the event as the “largest oil‑supply shock in history,” with daily losses approaching 20 million barrels.
Former U.S. President Donald Trump, in a recent interview, called the short‑term rise in oil prices a “small price to pay for peace,” predicting that prices would tumble quickly once the Iranian nuclear threat is lifted.
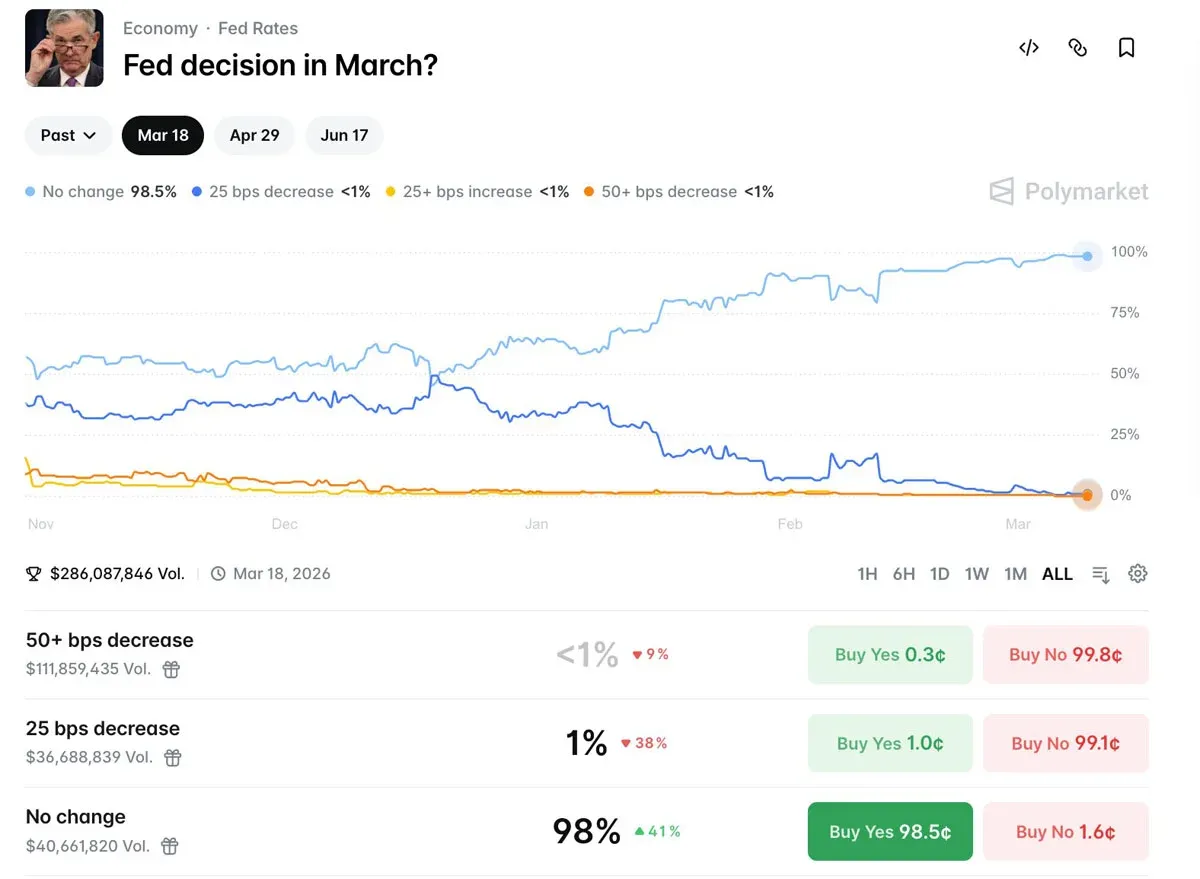
The rapid oil price climb has reignited global inflation concerns. Market consensus now sees the prospect of a 2026 rate cut as increasingly unlikely, with the Federal Reserve’s March 18 FOMC meeting estimated to keep rates unchanged with a 99 % probability and only a 27 % chance of a 25‑basis‑point cut sometime in 2026.
Should the Fed continue to hold rates high, the resulting tighter financial environment and a stronger U.S. dollar could exert downward pressure on Bitcoin, as investors often shift capital toward traditional safe‑haven assets such as gold, leading to short‑term volatility for the cryptocurrency.
---
Summary
Although the current oil price spike may recede once hostilities subside, historical experience shows that such shocks are usually short‑lived. By contrast, Bitcoin’s long‑term performance remains superior to traditional markets. If bullish technical signals continue to appear alongside rising volume, the $67,000 support level could evolve into a launchpad for further gains.
This completes the full analysis of “Oil Shock ‘Storm’ Arrives, Bitcoin (BTC) at 67,000 Becomes the ‘Anchor’, Is the Bottom Visible?”. For more in‑depth coverage of oil‑price dynamics and Bitcoin price action, stay tuned to the Bitaigen (比特根) platform’s upcoming articles.
Note: Cryptocurrency gains may be subject to tax in your local jurisdiction.
For U.S. residents: when trading on Binance, be sure to use Binance.US rather than the global Binance platform.
---
💡 Register on Binance with referral code B2345 for the maximum trading fee discount. See Binance complete guide.


