
Bitcoin is once again challenging a key psychological threshold, and the market currently stands at a critical crossroads between bulls and bears. Through a comprehensive review, the Bitaigen editorial team has observed that the current upward trajectory is accompanied by complex "chip" (holding) exchanges and a notable divergence in institutional sentiment. We have conducted a deep dive into the real driving forces behind the market from three major dimensions: on-chain data, whale movements, and the macroeconomic environment. This article aims to provide readers with an objective perspective on this market "game," clarifying whether there is a risk of a "bull trap" and helping you discern the underlying trend logic amidst intense volatility.
Bitcoin (BTC) Price Reclaims $70,000 Today: A Solid Breakout or a Bull Trap?
On March 10, the price of Bitcoin (BTC) successfully reclaimed the $70,000 psychological milestone. Following a period of intense volatility and range-bound consolidation, the market has once again arrived at a crossroads: Is this the starting point of a new main wave in the bull market, or is it a sophisticated "bull trap" orchestrated by major capital? This article will analyze the long-short game behind the $70,000 level from the perspectives of on-chain chip structures, institutional capital flows, and macroeconomic geopolitical risks.

As Bitcoin stands at the $70,000 mark today, the market is exhibiting characteristics of loosening on-chain holdings and a divergence in institutional funding. In the short term, due to the reduction of holdings by whales and the persistence of macroeconomic and geopolitical risks, a definitive bullish consensus has not yet formed. Investors must remain vigilant regarding the risk of a "pump and dump" bull trap.
On-Chain Data Reveals Deep Divergence in Chip Structure
On-chain data serves as a core indicator for gaining insight into the market's true intentions. To determine whether today's Bitcoin price breakthrough above $70,000 constitutes "solid support," we must pay close attention to the behavioral differences among various holder groups.
1. The Divergence Between Whale Distribution and Retail Accumulation
According to statistics from CryptoQuant, approximately 43% of the current Bitcoin supply is in a state of "unrealized loss." This implies that nearly half of all holders are still hovering around their break-even point. Once the price moves further upward, these "trapped" positions are highly likely to convert into significant selling pressure as investors seek to exit at cost.
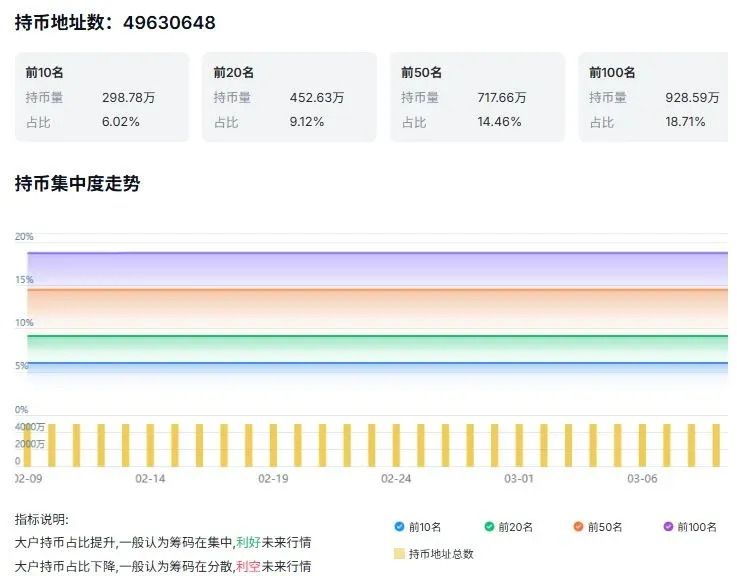
Data from Santiment reveals a cautionary signal: Whale addresses (those holding between 10 and 10,000 BTC) have shown a clear tendency to reduce their holdings during the recent rebound. Between February 23 and March 3, these large holders accumulated heavily within the $62,900 to $69,600 range. However, as the price surged toward $74,000, they rapidly offloaded approximately 66% of those newly acquired chips. Conversely, retail addresses holding less than 0.01 BTC have continued to increase their positions. This structure of "major players distributing while retail takes over" typically suggests that short-term market risks are accumulating.
2. Exchange Inventory at Historic Lows
The Exchange Reserve has plummeted to approximately 2.7 million BTC, returning to levels last seen in 2019. Data shows that between February 27 and March 5, exchanges saw a net outflow of over 44,000 BTC, marking the largest single-week outflow in nearly a year.
- Single-day outflow on March 4: 31,900 BTC
- Binance March Snapshot: BTC assets decreased by 8,004 BTC compared to the previous month. (Note: US-based users must utilize Binance.US, as the global platform is restricted in that jurisdiction).
This reduction in liquidity means that the "selling depth" in the market is thinning. Consequently, even relatively small capital flows can trigger violent price fluctuations. While low supply is generally bullish, it also increases the susceptibility to flash crashes if large orders hit the books.
Macro Funding: The Capital Game of Spot ETFs
Bitcoin's return to $70,000 in this cycle is closely tied to the capital flows of Spot Bitcoin ETFs.
According to monitoring data from SoSoValue, between March 2 and March 6 (Eastern Time), spot ETFs showed an overall net inflow totaling $568 million. However, the internal divergence among institutions is quite pronounced:
- BlackRock (IBIT): Demonstrated strong performance, contributing a net inflow of $660 million in a single period.
- Fidelity (FBTC): Showed a contrarian move, with an outflow of $153 million.
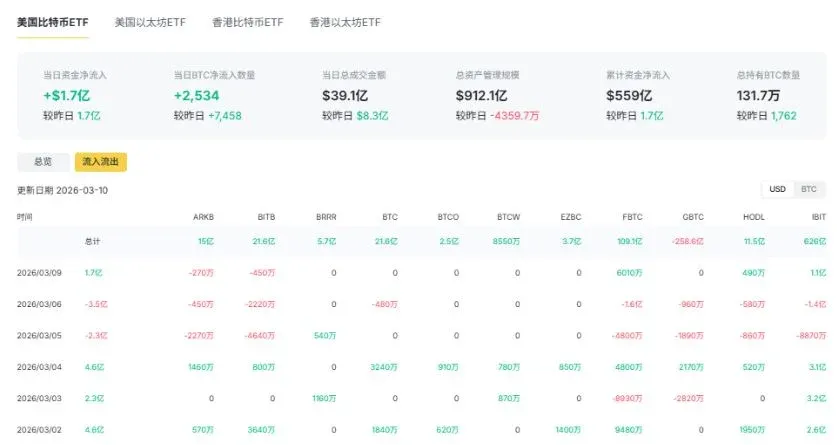
This divergence in institutional operations indicates that although ETF funds have maintained net inflows for four consecutive weeks, institutional investors have not reached a unanimous bullish consensus. The "intermittent" nature of these fund flows suggests that institutions are currently focusing on exploratory position-building rather than an all-out offensive.
Suppression Signals from Geopolitics and Macroeconomics
Fluctuations in macroeconomic fundamentals represent the largest external variable for the current crypto market. Recently, tensions in the Middle East have remained high, directly threatening the security of the Strait of Hormuz, a vital artery for global oil transportation.
| Core Influencing Factor | Status Description | Impact on Bitcoin |
|---|---|---|
| **Global Oil Prices** | Surged briefly to $119 per barrel | Raises global inflation expectations, suppressing risk assets |
| **Monetary Policy** | The **Federal Reserve** (Fed) may maintain a hawkish stance | Delays interest rate cut expectations, tightening market liquidity |
| **Risk Appetite** | Balance between "Oil Price Fire" and "Rate Cut Glacier" | Leads to severe volatility at the $70,000 threshold |
Inflationary expectations driven by high oil prices may force the Federal Reserve to maintain high interest rates for a longer duration. This provides a fundamental liquidity headwind for Bitcoin and other risk assets. Furthermore, investors should be aware that any realized gains from Bitcoin trading may be subject to capital gains tax based on local jurisdictions (e.g., the IRS in the US, or specific tax laws within the SEPA/Eurozone).
Conclusion: Three Signals Required to Confirm "Solid Support"
While Bitcoin's current position above $70,000 shows a breakout trend in technical terms, the risk of a "bull trap" has not been entirely eliminated. For the market to confirm that it has effectively established solid support, the following three core conditions must be met:
- Absorption of Historical Overhead Supply: The market must effectively increase trading volume and completely absorb the historical "trapped" chips concentrated in the $70,000 to $75,000 range.
- Stability of ETF Inflows: Spot ETFs need to move away from the "fast-in, fast-out" short-term gaming model and transition toward sustained and stable net inflows.
- Easing of Macro Tensions: Geopolitical conflicts must cool down, or inflation data must show a clear signal of peaking and retreating.
Operational Suggestion: At the $70,000 threshold, it is recommended that investors remain calm and wait for "right-side" confirmation signals. If the price can break through $71,500 with significant volume, the upside potential may open up. However, if the market continues to consolidate on shrinking volume, one should be wary of the risk of a retracement to the $68,000 support level.
---
*The content of this article is for informational purposes only and does not constitute any investment advice. The cryptocurrency market carries extremely high risk; please make decisions cautiously. Capital gains may be taxable depending on your local regulations.*
Related Reading
- Bitcoin Restaking 2025: Guide to Top Projects & Risks
- Bitcoin Price Tracker: Real‑Time Charts, Buying Tips, Trends
- BTC & Crypto Investment: Short, Medium & Long-Term
💡 Register on Binance with referral code B2345 for the maximum trading fee discount. See Binance complete guide.


