

In this article we outline the latest weekly technical pattern for Bitcoin, combine it with current macro‑risk sentiment and commodity price movements, assess how its valuation diverges from gold, and discuss the potential impact of an emerging key trendline on future price action. If you want to see the possible price ranges that may follow, keep reading.
*For fiat transactions, USD via SEPA or SWIFT is the standard method in the global market. U.S. residents should use Binance.US rather than the global Binance platform.*
Bitcoin traders say everything hinges on oil and gold
The ongoing Middle‑East tensions have heightened macro‑risk sentiment, shifting market focus toward commodities and traditional safe‑haven assets. Crypto analyst and entrepreneur Michaël van de Poppe directly linked the movements of gold and crude oil to Bitcoin’s recent rebound.
“Tomorrow all eyes will be on the oil and gold‑silver race. If those trends turn toward Bitcoin, we could see a top‑up in the coming week, and the worst moment is already behind us,” he wrote on X.
WTI crude closed Friday up roughly 16 %, while gold, after flirting with a historic high, slipped below the $5,200 level. Faced with a relative strength index (RSI) that has plunged to a historic low, van de Poppe argues that Bitcoin is significantly undervalued relative to precious metals.
“$BTC’s valuation relative to gold has not changed. The current RSI is at an all‑time low, indicating that gold is overvalued in the short term while Bitcoin is undervalued.”
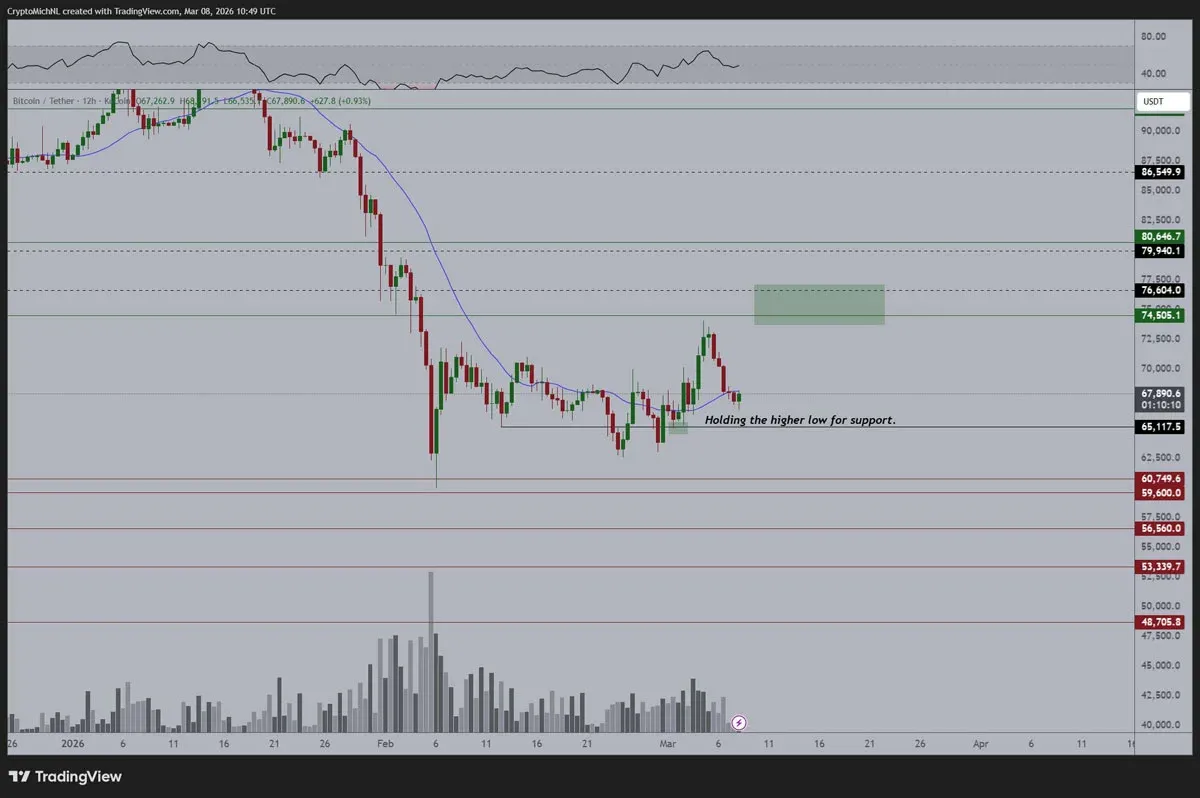
BTC/USDT 12‑hour chart. Source: Michaël van de Poppe/X
“If that’s not the case, and we test lower prices again, I’ll become a big buyer around the $60,000 area.”
BTC price and the 200‑week EMA under the spotlight
Data from TradingView shows that over the weekend BTC/USD found a low near $66,569, causing Bitcoin to slip beneath the critical 200‑day exponential moving average (EMA). This moving average has attempted to act as support several times but has repeatedly failed to hold.
Trader Rekt Capital noted in an X post that if Bitcoin continues to close below the $68,310 200‑week EMA this week, the level will further cement its role as resistance.
“In fact, Bitcoin has broken the 200‑day EMA again, erasing the massive gains from the recent bounce,” he wrote.
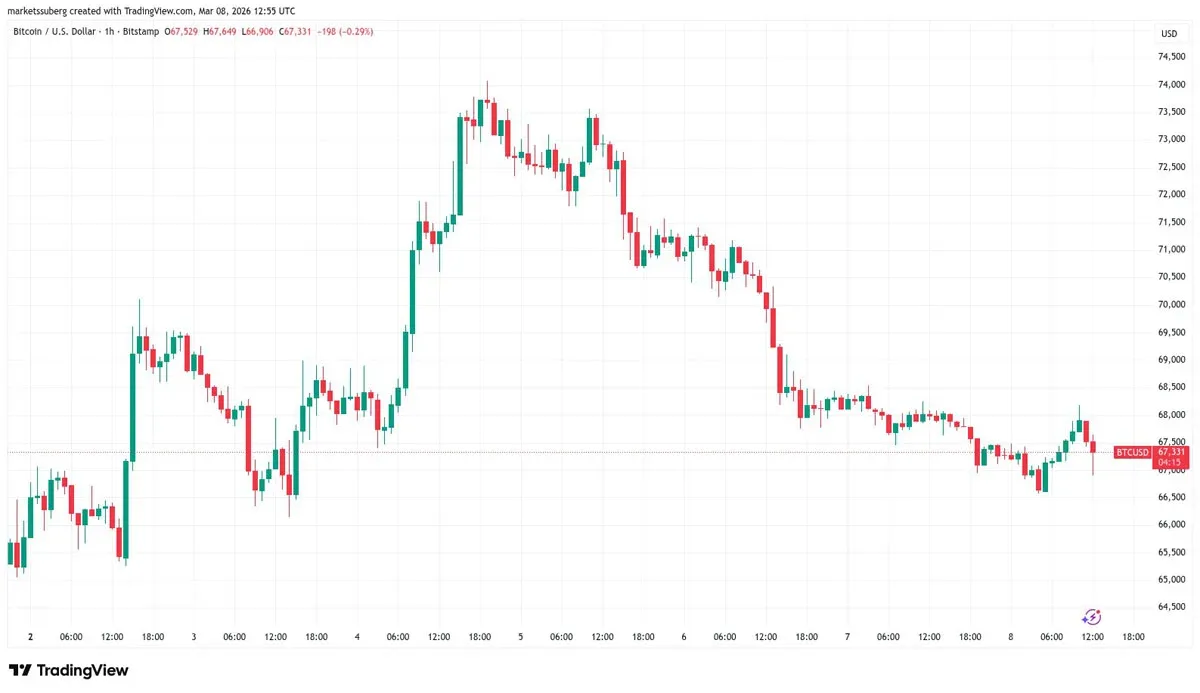
BTC/USD 1‑hour chart. Source: Cointelegraph/TradingView
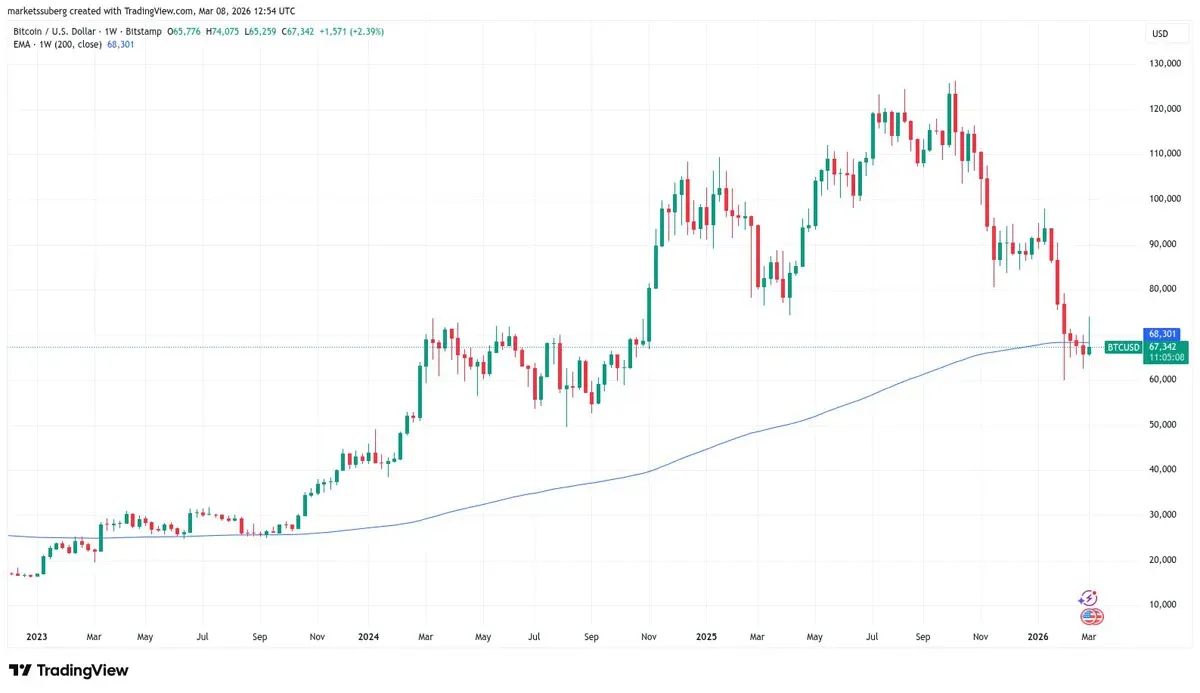
BTC/USD weekly movement, EMA 200. Source: Cointelegraph/TradingView
It is worth noting that since early March 2023, BTC/USD has been unable to close above the 200‑week EMA on the weekly timeframe. A more optimistic view comes from trader Merlijn, who believes that if price touches the 200‑week EMA again, the market could replay the 2023 structure and spark a fresh rally.

Key takeaways
- This week Bitcoin is likely to encounter firmer resistance around the 200‑week EMA, testing its technical strength.
- The current price has yet to turn the critical trendline into a reliable support, with breakout attempts repeatedly thwarted.
- Fluctuations in oil and gold are viewed as the primary external drivers of Bitcoin’s short‑term trajectory.
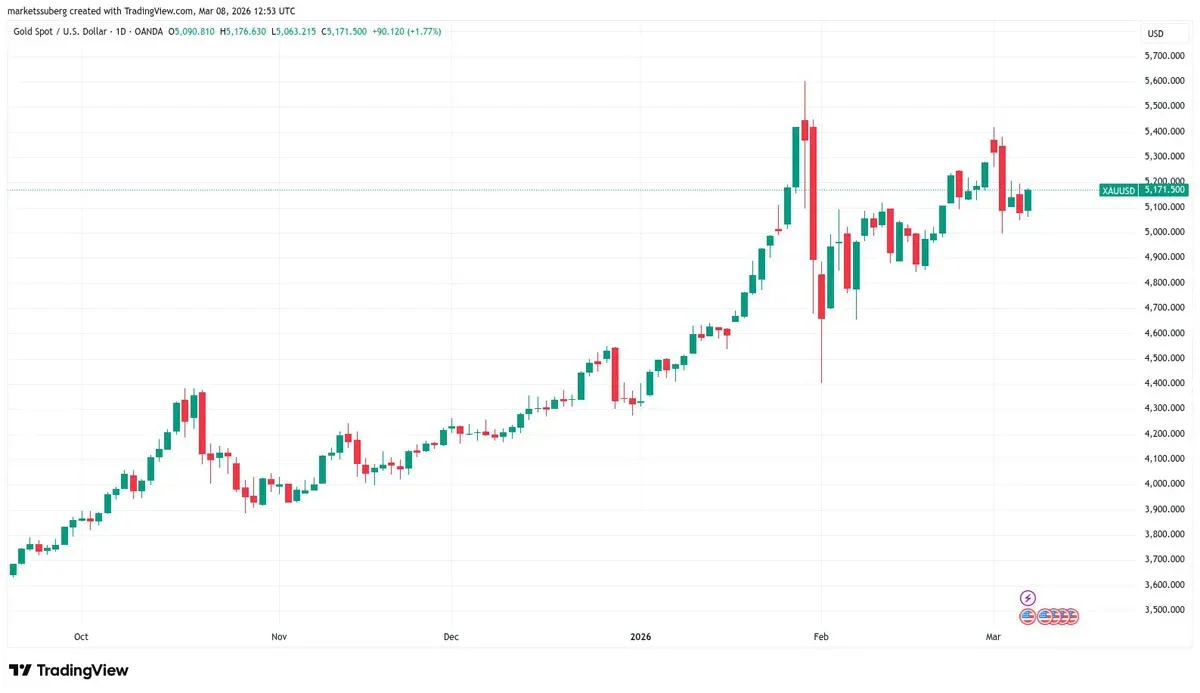
XAU/USD daily chart. Source: Cointelegraph/TradingView
Bitcoin (BTC) is currently facing a dual test from both technical and macro perspectives. If it can close the week above the 200‑week EMA, a $60,000 target becomes a plausible scenario. For deeper analysis of Bitcoin’s weekly outlook and the $60,000 goal, stay tuned to Bitaigen’s future reports.
💡 Register on Binance with referral code B2345 for the maximum trading fee discount. See Binance complete guide.

