
 Bitaigen Research
 In the past, people evaluating crypto assets often relied on price charts, market sentiment, and project narratives. As the DeFi ecosystem matures, pure hype can no longer sustain long‑term investment decisions. At this point, on‑chain fundamentals have become a key tool for filtering genuine value signals—they help us quickly identify protocols with structural advantages amid the flood of information.
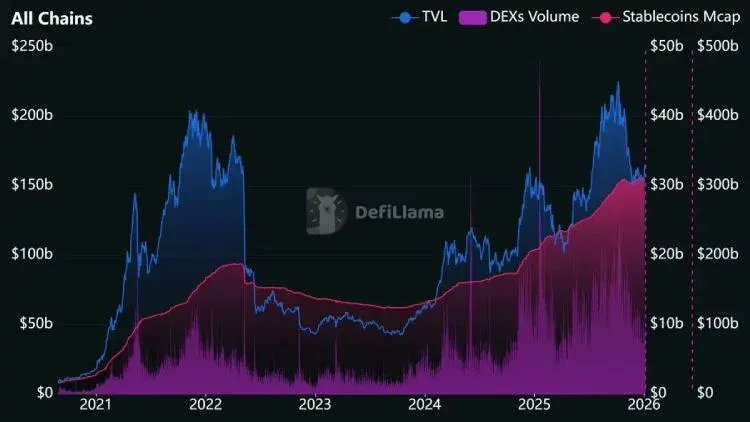
In this article we systematically outline the core concepts and common tools of DeFi metrics, showing how to use on‑chain data to quickly screen protocols with structural advantages, helping investors capture potential high‑quality projects amid information noise. For practical methods, keep reading.
Why DeFi Metrics Matter
The emergence of on‑chain data not only adds a brand‑new dimension to crypto‑asset analysis, it also represents a revolutionary breakthrough for the whole financial‑data ecosystem. Traditional investors can only access a company’s operating conditions after quarterly or semi‑annual earnings releases, whereas a DeFi protocol’s financial information is written to the blockchain in real time and can be queried at any moment. Platforms such as DefiLlama even refresh data hourly, and, if needed, can read raw transaction records directly from the chain to monitor revenue flows on a minute‑by‑minute basis (although such fine‑grained volatility does not always carry practical significance).
This heightened transparency means that evaluating a DeFi project no longer depends on management reports or audits; instead, analysts can read directly from an immutable ledger. It is important to note that not every crypto project can provide valuable on‑chain metrics. Pure “meme coins,” air‑only projects that exist solely with a whitepaper and a Telegram group, typically lack traceable fundamental data—though community metrics such as the number of token holders can still serve as a reference. Conversely, protocols that generate fees, absorb deposits, and distribute value to token holders leave clear footprints on‑chain, often revealing trends earlier than market narratives.
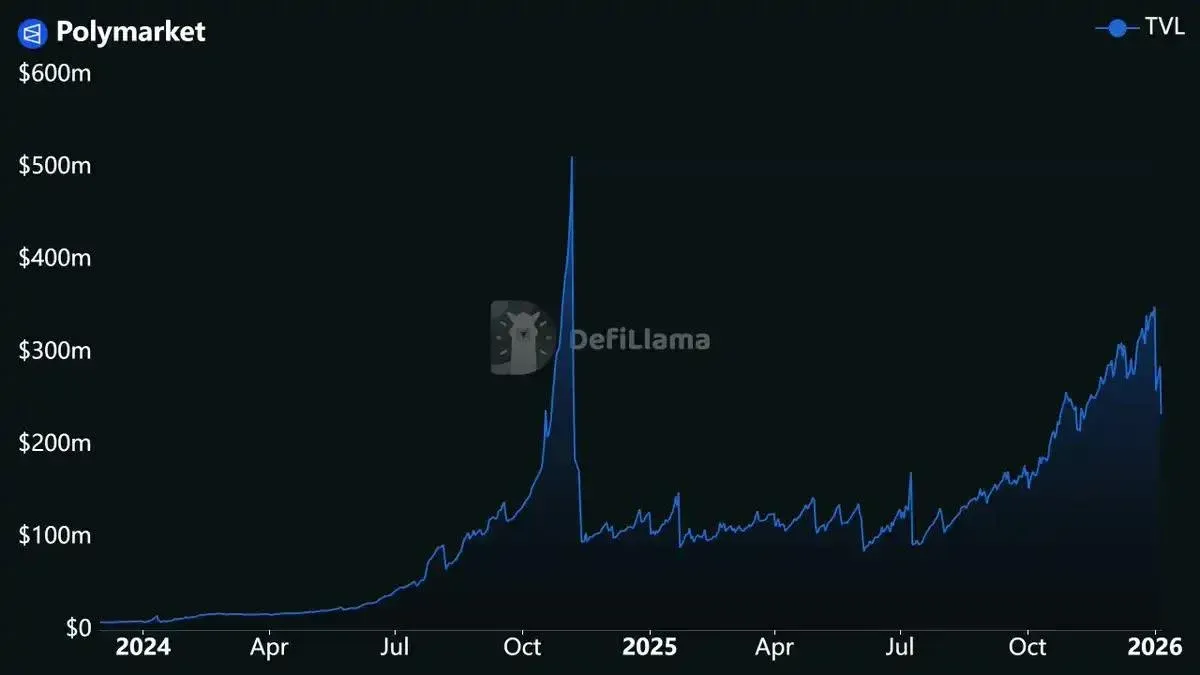
For example, Polymarket’s liquidity has been steadily increasing over the past few years, a signal that preceded the explosion of prediction‑market hype.
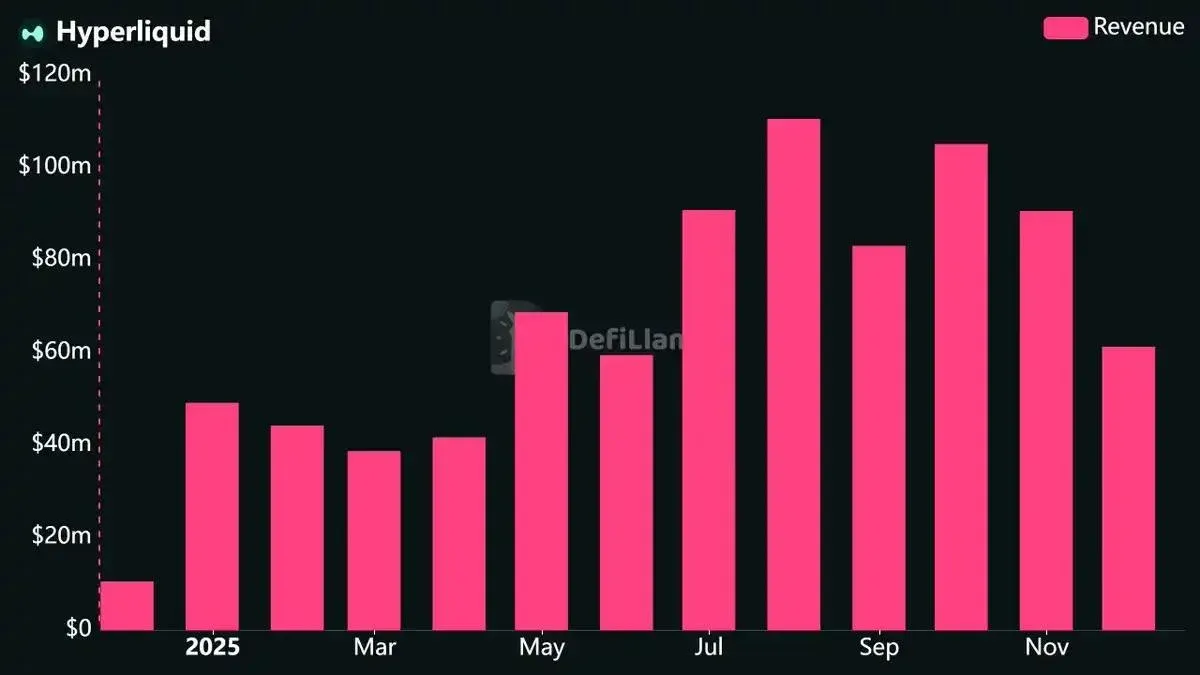
The HYPE token’s price surge last summer also stemmed from its consistently high fee revenue.
Once you know where to look, these on‑chain signals have long hinted at the subsequent price action.
Core Metric Breakdown
When learning about DeFi investing, mastering the following key metrics is especially important.
Fees, Revenue, and Holders’ Revenue
- Fees: The actual cost users pay when interacting with a protocol, such as the trading fee incurred on a DEX swap. Fees may be fully routed to liquidity providers, or partially funneled into the protocol’s treasury. This is analogous to gross revenue in traditional finance.
- Revenue: The portion of user fees that the protocol retains and directs to its treasury, team, or token holders. It can be seen as gross income in a conventional sense.
- Holders’ Revenue: Specifically the earnings distributed directly to token holders via buy‑backs, fee burns, or staking rewards—similar to dividends + share repurchases in traditional markets.
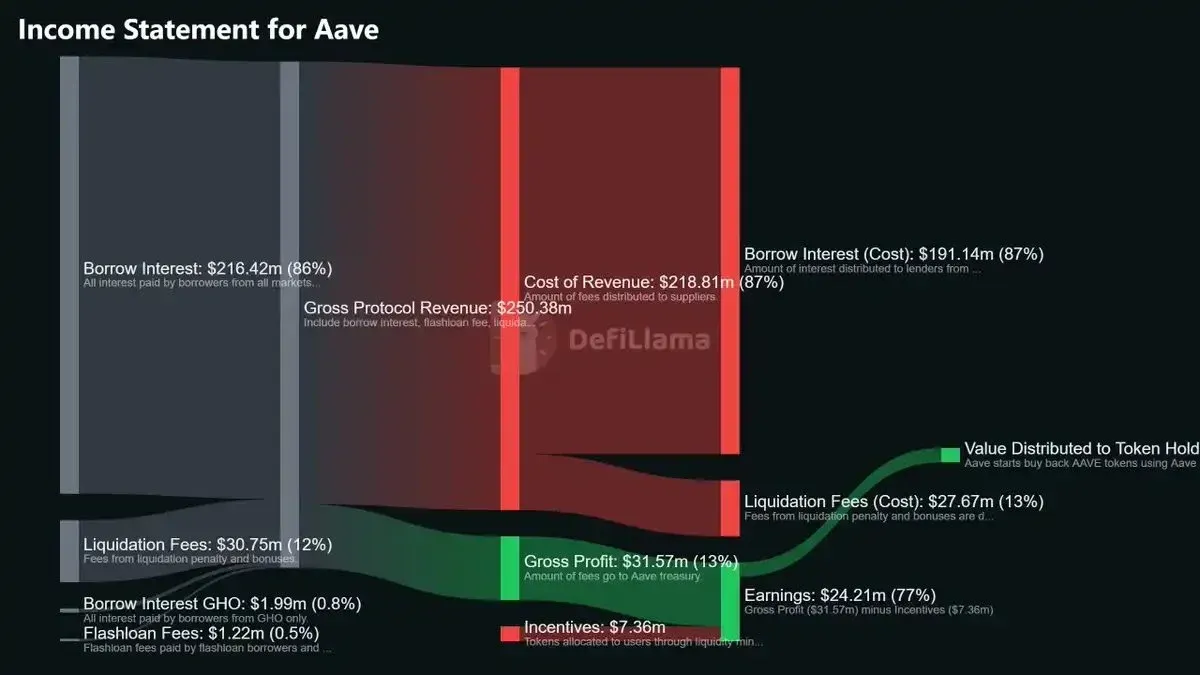
DefiLlama supplies automatically updated income statements for many protocols, breaking down fees, revenue, and holder allocations and presenting them in standard accounting language.
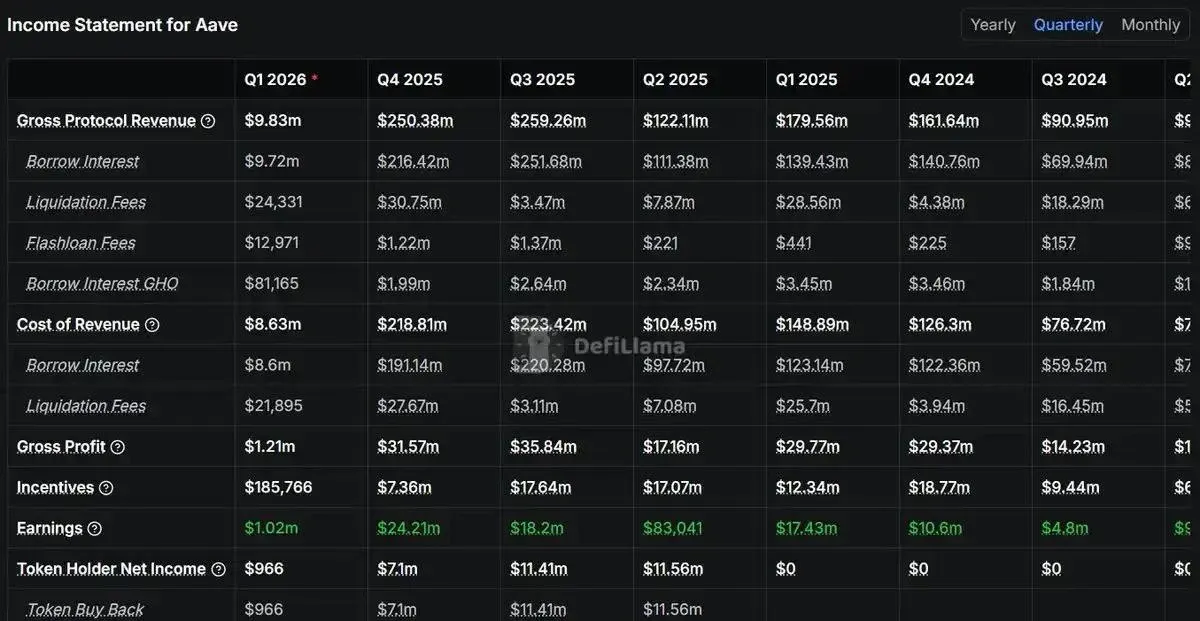
Accompanying cash‑flow diagrams visually illustrate how user capital entering a protocol is distributed among different stakeholders, helping researchers deeply understand a project’s economic model.
TVL (Total Value Locked)
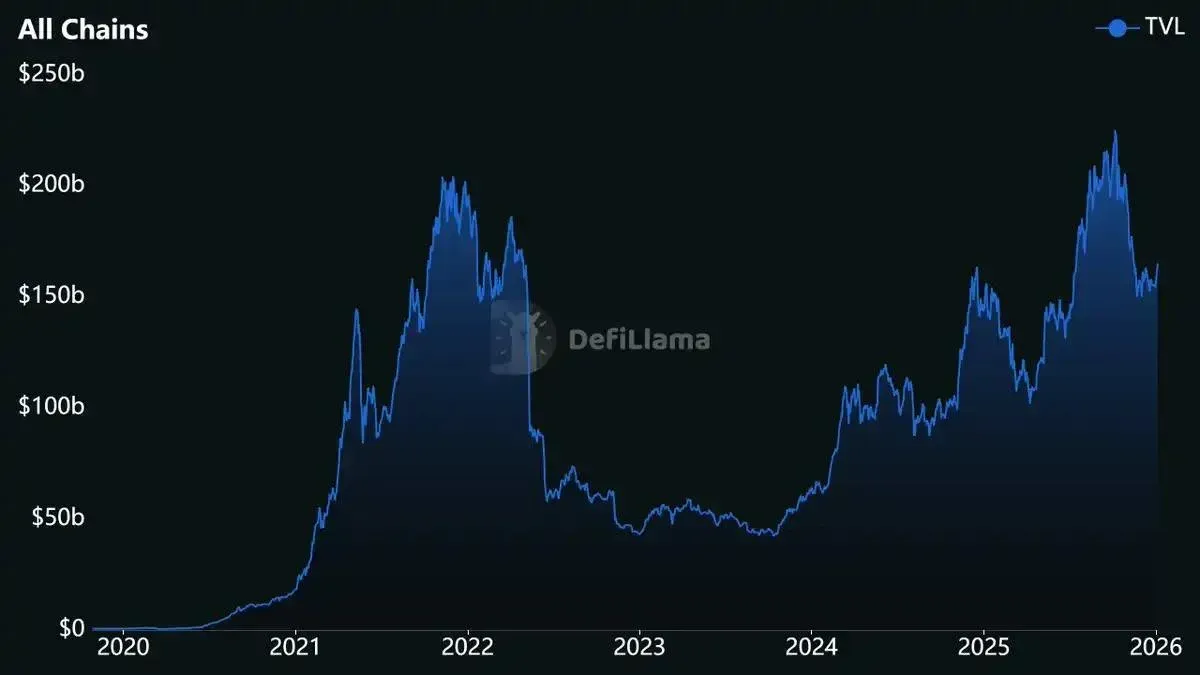
TVL represents the total value of assets deposited into a protocol’s smart contracts. Different protocol types count TVL slightly differently:
- Lending platforms: Include both collateral and loaned assets.
- Decentralized exchanges (DEXes): Refer to the deposits sitting in liquidity pools.
- Blockchains: Aggregate the locked value across all protocols on that chain.
In traditional finance, TVL is comparable to assets under management (AUM), reflecting users’ trust in the protocol. However, TVL has limitations:
- It does not measure activity: A huge TVL with almost zero fee generation indicates a protocol that is not being used.
- It is price‑sensitive: When ETH drops 30 %, all ETH‑denominated TVL on every protocol falls by the same percentage, even if the underlying deposits remain unchanged.
To separate price effects from real capital inflows, analysts often pair TVL with USD Net Inflows. USD Net Inflows are calculated by comparing the asset balances of two consecutive days (multiplied by the respective market prices), revealing genuine fund movements despite price volatility. For instance, a protocol that holds an all‑ETH vault will see its TVL decline 20 % when ETH falls 20 %, but its USD Net Inflows will be $0, indicating no actual withdrawals.
When TVL is reported both in USD and in native tokens, and is combined with activity‑based metrics such as fees or revenue, it remains a vital reference for gauging protocol scale and user confidence.
Volume
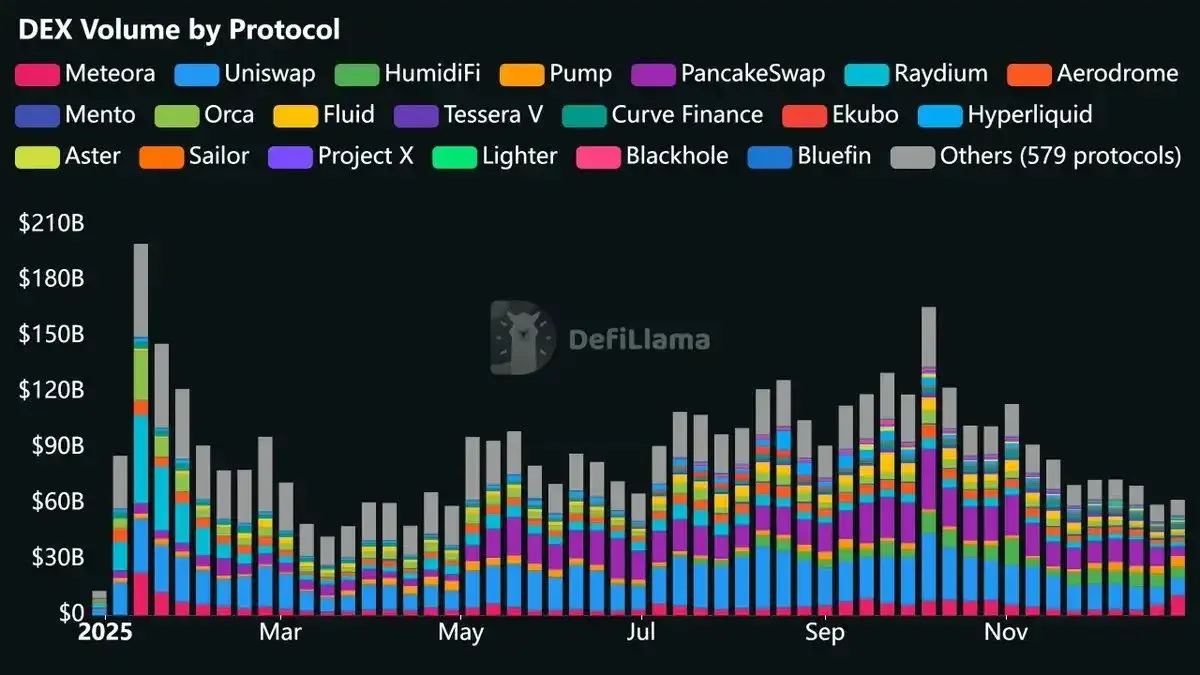
Volume measures how frequently a protocol is used and falls into two major categories:
- DEX Volume: Aggregates all token‑swap activity across decentralized exchanges.
- Perpetual‑Contract Volume (Perp Volume): Captures the total notional traded on perpetual‑contract platforms.
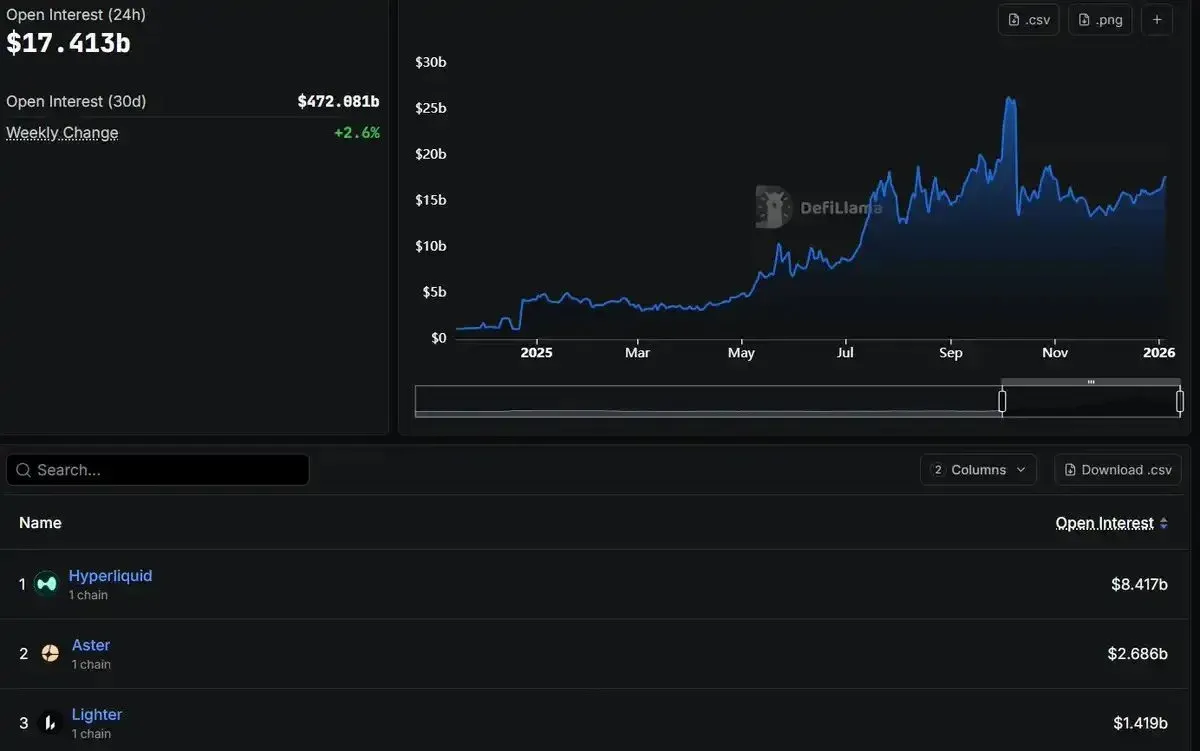
Volume spikes usually track market sentiment: enthusiasm drives soaring trade numbers, while panic selling also generates large‑sized transactions. In recent years, perpetual‑contract turnover has grown dramatically; platforms such as Hyperliquid, Aster, and Lighter now record daily volumes in the billions of USD. Because this sector is still expanding rapidly, direct comparisons with 2021 data are of limited relevance; more insightful is the change in market share. For example, if a perpetual‑contract DEX expands its market share from 5 % to 15 %, even a slight dip in absolute volume suggests an improving competitive position. DefiLlama’s custom dashboards provide rich share‑trend charts for reference.
Open Interest
Open interest denotes the total notional value of derivative positions that have not yet been closed or liquidated, primarily used to gauge liquidity depth on perpetual‑contract DEXes. This metric can shrink rapidly during volatile market episodes—a massive forced liquidation may erase open interest within hours. Observing how quickly open interest recovers after extreme events helps determine whether a platform can re‑attract liquidity or if funds have permanently migrated elsewhere.
Stablecoin Market Cap
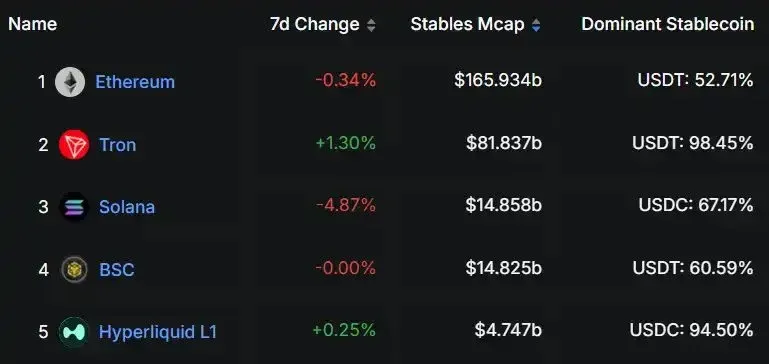
For a given blockchain, the stablecoin market cap is the total value of all stablecoins residing on that chain. Unlike TVL, which fluctuates with token price movements, stablecoins represent the actual USD (or equivalent) capital that users have bridged into the ecosystem. For instance, if a chain’s stablecoin market cap rises from $3 billion to $8 billion, it indicates a net inflow of $5 billion of real capital into that ecosystem. Since October 2023, roughly $180 billion has entered the crypto market in stablecoin form, with a substantial portion flowing into DeFi, simultaneously driving up TVL, volume, and fee generation. Changes in stablecoin supply can be likened to a nation’s capital‑inflow and outflow statistics.
App Revenue & App Fees
These chain‑level metrics aggregate the revenue and fees generated by all applications on a particular blockchain, excluding stablecoins, liquidity‑staking contracts, and the gas fees themselves. They can be thought of as the chain’s GDP, providing a clear snapshot of the overall economic activity within the ecosystem. Revenue data is hard to falsify because it requires genuine user spend. Consequently, it serves as a strong signal of DeFi ecosystem vitality. However, chain‑level revenue alone should not be used directly for token valuation; it is more appropriate as a diagnostic tool for chain growth rather than a standalone valuation metric.
How to Effectively Interpret These Metrics
Relying on a single metric yields only a fragmentary view; a comprehensive analysis framework requires the integration of multiple data dimensions. Below is a three‑step approach I frequently employ:
1. Prioritize Sustained, Stable Growth
If a protocol’s revenue curve exhibits a short‑term spike followed by a rapid decline, the growth is likely not repeatable. The more meaningful pattern is a steady upward trajectory over a longer window. For example, a project that lifts monthly revenue from $500 k to $2 M over six months mirrors six consecutive quarters of growth in traditional markets, offering higher credibility.
2. Monitor Stock and Flow Metrics Simultaneously
- Stock Metrics: TVL, open interest, stablecoin market cap, treasury balances, etc., reflect the cumulative capital residing in the protocol.
- Flow Metrics: Fees, revenue, volume, etc., reveal how that capital is actively being used.
Both categories are indispensable. Flow can be artificially inflated through short‑term incentives or wash‑trading, whereas stock metrics are harder to fabricate. When evaluating a protocol, pair the appropriate metrics with its business model—for instance, a perpetual‑contract DEX should be examined via open interest + volume, a lending platform via TVL + fees, and an entire blockchain via stablecoin market cap + app revenue. If both stock and flow metrics move upward together, the protocol is both attracting capital and generating activity. If only one side rises, deeper investigation is needed to uncover potential manipulation or asymmetric effects.
3. Factor in Token Unlock Schedules and Incentive Costs
Token release schedules directly affect market supply; a large tranche of tokens unlocking without commensurate demand will generate sell pressure. Reviewing a project’s circulating supply and future unlock timetable helps gauge dilution risk. At the same time, high‑revenue protocols that rely heavily on token incentives to attract users may see their net earnings eroded by those costs. DefiLlama’s Earnings metric subtracts incentive payouts from gross revenue, offering a more objective view of profitability. For example, a protocol earning $10 M in revenue but distributing $15 M in token rewards ends up with negative net earnings, indicating that incentives outweigh the value created by the business.
---
The content above outlines the most commonly used DeFi metrics and how to interpret them. They represent only the tip of the iceberg; deeper research can uncover many more nuanced dimensions. For richer metric analyses, feel free to explore past articles from Bitaigen (比特根) or continue browsing the related links below. Thank you for reading, and we look forward to your continued interest and support for Bitaigen (比特根)!
*Note: Crypto gains may be taxable in your jurisdiction; consult a tax professional for guidance.*
*For fiat transactions, the global market typically uses USD, SEPA, or SWIFT transfers. U.S. users should conduct trades on Binance.US rather than the global Binance platform.*
Related Reading
- TradFi vs DeFi: Key Differences Explained
- TVL in DeFi: How It’s Calculated, Why It Matters
- Smart Contracts: Core Principles & Use Cases in DeFi & NFTs
💡 Register on Binance with referral code B2345 for the maximum trading fee discount. See Binance complete guide.



