
 Bitaigen Research
 In this article we systematically examine the technical significance of Bitcoin’s recent break below a key upward channel, and combine this with macro‑level funding conditions for an in‑depth assessment. An invited analyst starts from quantitative models to provide trading ideas and risk warnings, helping readers capture critical points amid volatility. Subsequent sections will dive into detailed analysis.
Bitcoin Market Analysis: Has the Key Channel Been Broken? Will History Simply Repeat Itself?
Bitcoin has now slipped below the lower boundary of a crucial upward channel, but whether this means history will fully repeat itself still requires a comprehensive judgment that incorporates subsequent price action and macro‑economic factors. This piece systematically organizes recent price movements, technical structures, and possible trading approaches to give readers a more complete view of market dynamics.
Invited market analyst: Cody, MSc in Financial Statistics, Columbia University. During university he focused on quantitative trading in U.S. equities, later expanding to Bitcoin and other digital assets. He has built systematic quantitative trading models and risk‑control frameworks. Every week he delivers deep dives into BTC technicals, macro conditions, funding flows, reviews practical strategies, and previews noteworthy upcoming events for reference.
---
Weekly Trading Report – Core Summary
- Short‑term strategy execution results: Last week we strictly followed the preset plan, completing a 1×‑leverage short‑term trade that yielded a 3.76 % profit (see Figure 1).
- Short‑term core view validation: The price rapidly fell through the $94,500‑$95,000 core zone, retreated into a $84,000‑$94,500 oscillation band, and found support near $86,000. The overall movement aligns closely with the original forecast.
The following sections will recap the market outlook, strategy execution, and the specific trade process.
---
1. Learning from History – A Dialectical View of the Current Market
Comparing the weekly‑level corrections that followed the two most recent BTC peaks reveals a striking structural similarity between the adjustment that began in October 2025 and the one that started in November 2021. Bitcoin is now at a pivotal technical decision point.
1. Key Technical Position: The Gains and Losses of the Channel’s Lower Boundary
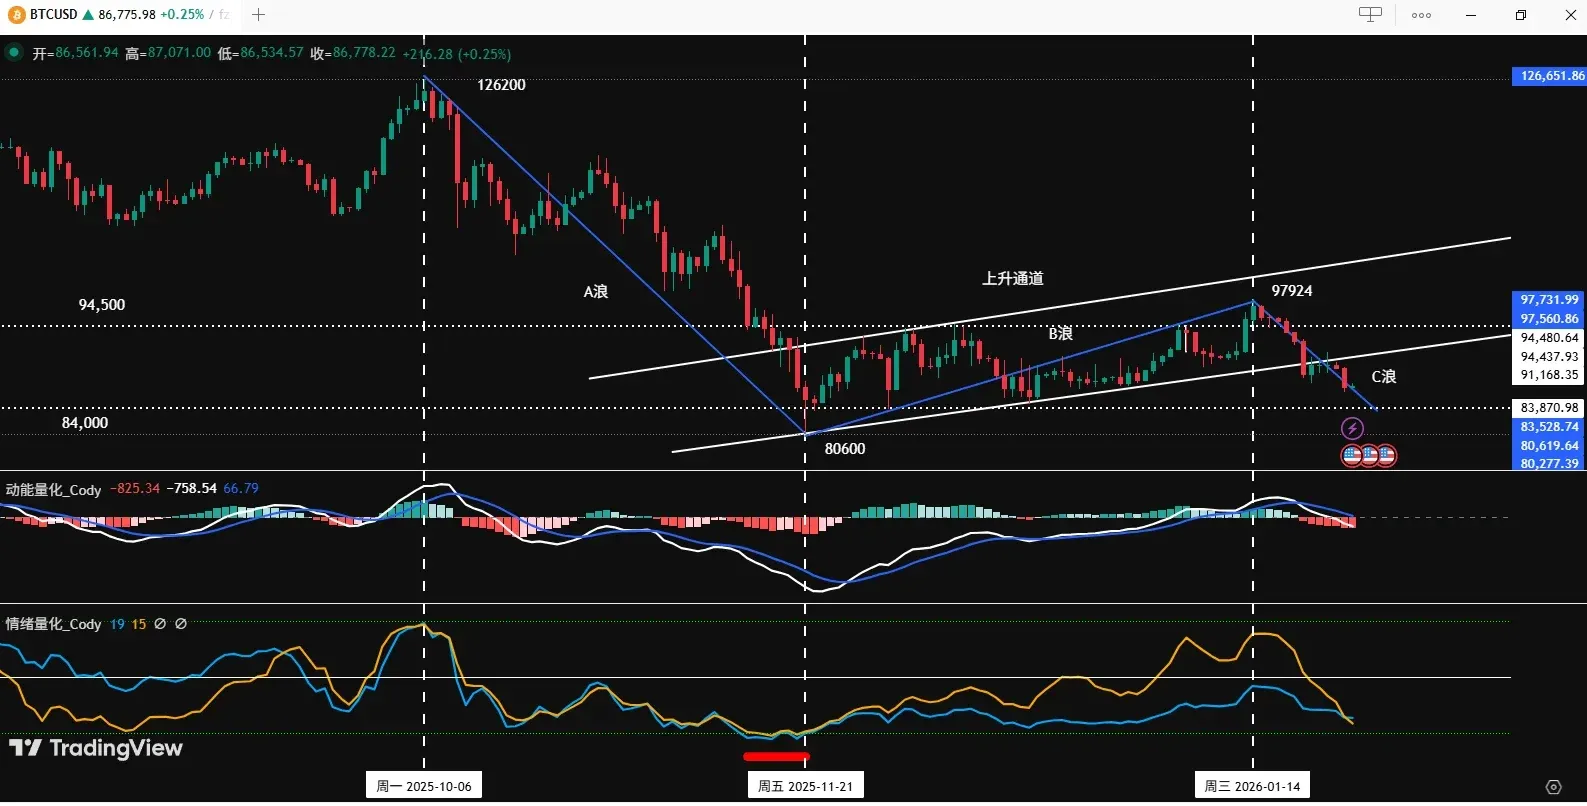
Since the November 21 2025 trough at $80,600, the rebound has carved a clear upward channel. The lower boundary of this channel acts as the lifeline that determines short‑term direction.
2. Two Possible Paths for Bitcoin’s Later Movement
- If the price re‑establishes itself above the channel’s lower boundary, the B‑wave rally could continue, first testing resistance around $94,500, then challenging the critical barrier near the 21‑week moving average. This path depends heavily on macro‑level support, especially a shift in Federal Reserve policy expectations toward easing.
- If the price breaks below the channel’s lower boundary and the daily‑level momentum line (daily) crosses under the zero axis, the daily chart may re‑enter bearish territory, implying that the B‑wave rally that began on November 21 2025 could be over and a C‑wave correction would proceed, with a heightened probability of slipping beneath $80,600.
3. Three‑Stage Correction Structure (Premise: Price Breaks Below the Channel’s Lower Boundary)
| Stage | Start → End (USD) | Duration | Decline / Gain |
|---|---|---|---|
| **A‑wave** | $126,200 (2025‑10‑06) → $80,600 (2025‑11‑21) | 46 days | **‑36 %** |
| **B‑wave** | $80,600 (2025‑11‑21) → $97,924 (2026‑01‑14) | 54 days | **+21.5 %** (technical recovery) |
| **C‑wave** | $97,924 (2026‑01‑14) → present | Ongoing | Watch the lower‑boundary outcome |
4. C‑wave Correction Target Forecast
- $80,600: If breached, this level would become the launch point of the B‑wave, completing the A‑B‑C three‑wave pattern.
- $75,200: Corresponds to the 50 % Fibonacci retracement of the A‑wave decline and aligns with the low of the April 2025 correction, forming a historically significant support.
“History may repeat, but it never does so in a simple, identical way” is a fundamental dialectic of financial markets. Rational forecasting should be based on a probabilistic blend of fundamentals and technical structure, not on deterministic prophecy.
---
2. Bitcoin’s Weekly Review (Jan 19 – Jan 25)
1. Short‑Term Trade Review from Last Week
| Item | Description |
|---|---|
| **Trading model** | Spread‑trade model + momentum‑quant model |
| **Leverage** | No leverage applied |
| **Return** | **3.76 %** |

Trade Details (Figure 1)
- Entry: Opened a 30 % short position at $92,565, triggered by a break of the $94,500‑$95,000 zone and three concurrent bearish signals (spread model, momentum model resonance, and a zero‑axis death‑cross on the momentum line).
- Exit: When the price fell to $89,078, the spread model issued a bottom‑alert, and the momentum model confirmed the trough. The position was fully closed, delivering the expected profit.
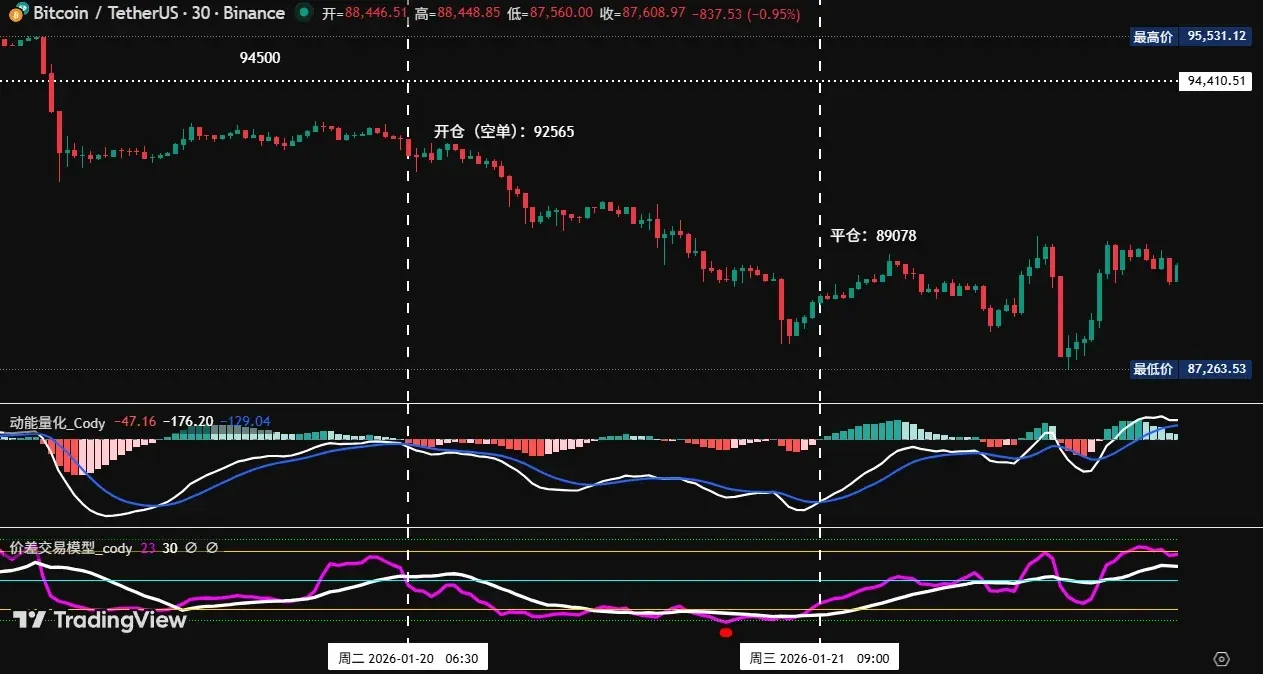
2. Last Week’s Outlook and Strategy Recap
- Key zone: $94,500‑$95,000 acted as the decisive pressure point for this wave; a breach was expected to push the market into a $84,000‑$94,500 swing range.
- Support tiers: First support $89,500‑$91,000; second support $86,000‑$86,500.
- Mid‑term strategy: Stay flat and observe.
- Short‑term strategy: Follow Plan B (short on a break of the key zone), entering a 30 % short, setting a stop‑loss 1.5 % above entry, and scaling out near $86,500 as model signals align.
---
3. Bitcoin’s Structural Outlook: Daily Chart Retains a Bearish Layout
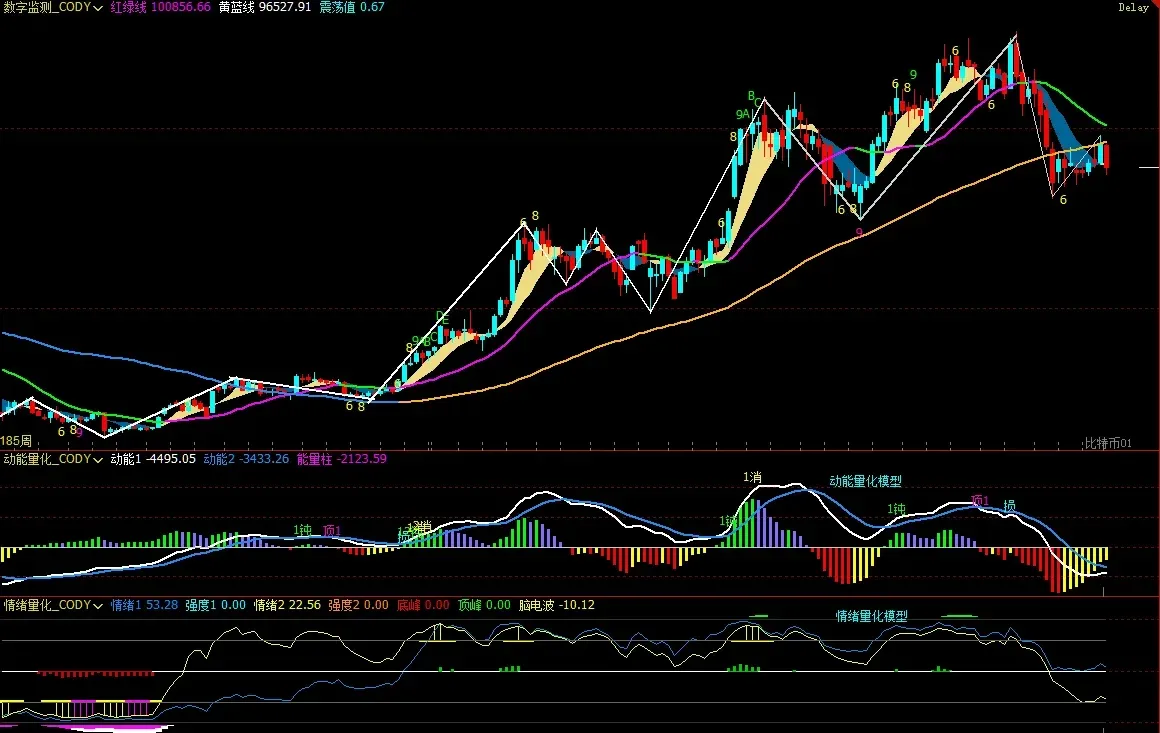
1. Weekly Perspective (Figure 2)
- Momentum‑quant model: Last week’s short‑term momentum release left both momentum lines in an “open‑mouth” formation; negative‑energy bars showed little change, indicating that bearish pressure remains.
- Sentiment‑quant model: Blue line at 53.28, yellow line at 22.56, both reflecting zero intensity, suggesting a neutral overall sentiment.
- Digital‑monitor model: Price has stayed below the long‑short demarcation for ten weeks, weekly candles closed with a large bearish body, a drop of roughly 7.55 %, forming a “strong‑top” bearish pattern.
Conclusion: The weekly chart shows a clear bearish trend for Bitcoin; traders should watch for continued down‑side volatility.
2. Daily Perspective (Figure 3)
- Momentum‑quant model: Displays a “down‑pause‑down” rhythm; Momentum Line 1 has already crossed under the zero axis, Momentum Line 2 is about to do the same, and negative‑energy bars are gradually expanding.
- Sentiment‑quant model: Blue line 19, yellow line 20, both at zero intensity, indicating a neutral pressure‑support index.
Conclusion: The daily chart is beginning to form a bearish configuration, though the battle for the zero axis still requires close monitoring.
---
4. This Week’s Market Forecast (Jan 26 – Feb 1)
1. Core Viewpoint
- Primary watchpoint: Whether the lower boundary of the upward channel holds or breaks.
- Break → Anticipate an accelerated decline, with the first target near $84,000.
- Hold → Expect constrained oscillation within the channel, limiting price swings.
2. Key Resistance Levels
- $88,500‑$91,200 (previous swing‑range core)
- $94,500‑$95,000 (previous swing‑range core)
- Around the 21‑week moving average
3. Key Support Levels
- $86,000‑$86,500 (dense‑chip zone)
- $84,000 (bottom edge of the price box)
- $80,000‑$80,600 (November 2025 low)
---
5. This Week’s Operational Strategies (Assuming No Sudden News Shocks)
| Horizon | Action Points |
|---|---|
| **Mid‑term** | If the channel’s lower boundary is breached, consider establishing a **60 %** short position. |
| **Short‑term** | Deploy **30 %** of capital, set stop‑losses, and look for **spread** opportunities around support/resistance zones on a 30‑minute chart. |
| **Focus** | Track the fate of the channel’s lower boundary, dynamically combine model signals, and execute **Plan A** or **Plan B** accordingly. |
Plan A (Break Below Lower Boundary)
- Entry: After a break and a confirming top signal from the models, open a 30 % short.
- Risk control: Place stop‑loss 1.5 % above the entry price (1.015 × entry).
- Exit: Gradually close the position when price reaches a major support and a bottom signal appears on the models.
Plan B (Hold Above Lower Boundary)
- Entry: If price rebounds to a resistance level or meets resistance at the channel’s upper boundary, combine a top model signal to open a 30 % short.
- Risk control: Same as Plan A.
- Exit: Scale out when price falls back to the channel’s lower boundary or a support level and model signals turn bearish.
---
6. Special Reminders
- Set a stop‑loss at the moment of entry to guard against sudden spikes.
- When profit reaches 1 %, move the stop‑loss to the break‑even price.
- When profit reaches 2 %, shift the stop‑loss to the 1 % profit level.
- For every additional 1 % gain, raise the stop‑loss by another 1 %, achieving a dynamic protection mechanism.
---
*The above constitutes the full analysis titled “Bitcoin Market Analysis: Has the Key Channel Been Broken? Will History Simply Repeat Itself?” For more Bitcoin market insights, stay tuned to Bitaigen’s upcoming articles.*
*Note: All fiat transactions referenced use USD; cross‑border transfers can be conducted via SEPA or SWIFT channels. U.S. readers should access Binance.US rather than the global Binance platform. Crypto gains may be taxable under the regulations of your local jurisdiction.*
Related Reading
- Bitcoin $90,000 Rejection: Is Digital Gold Losing to Bonds?
- Bitcoin MVRV Metric: Gauge Market Sentiment & Spot Bubbles
- Bitcoin Breaks Key Support: Is Its “Digital Gold” Status at Risk?
💡 Register on Binance with referral code B2345 for the maximum trading fee discount. See Binance complete guide.



