
 Bitaigen Research
By analyzing on‑chain data, we identify a pivotal turning point that suggests Bitcoin is entering an early‑stage bear market. The current price is edging close to a crucial support zone; a break below could intensify selling pressure. This article dissects cost baselines, supply structure, and potential future trajectories to help you gauge the next phase of market rhythm.
Key Takeaways
- On‑chain metrics show that Bitcoin’s net realized profit/loss has slipped into negative territory, indicating waning market momentum and a possible alignment with broader macro‑downturn trends.
- Buying pressure has congested in the $80,000‑$84,000 range, making it the most important support level at present.
Price Ranges to Watch Next
Recent sell‑offs have pulled the BTC/USD pair roughly 9 % down from its 2026 peak of $97,930, breaching several key support levels.
- The 75 % cost‑basis sits near $92,940; a breach could trigger additional downside pressure.
- Glassnode’s analysis on X notes that the price is now below the cost basis of the bottom 75 % of supply, implying that downside risk dominates unless the level is reclaimed.
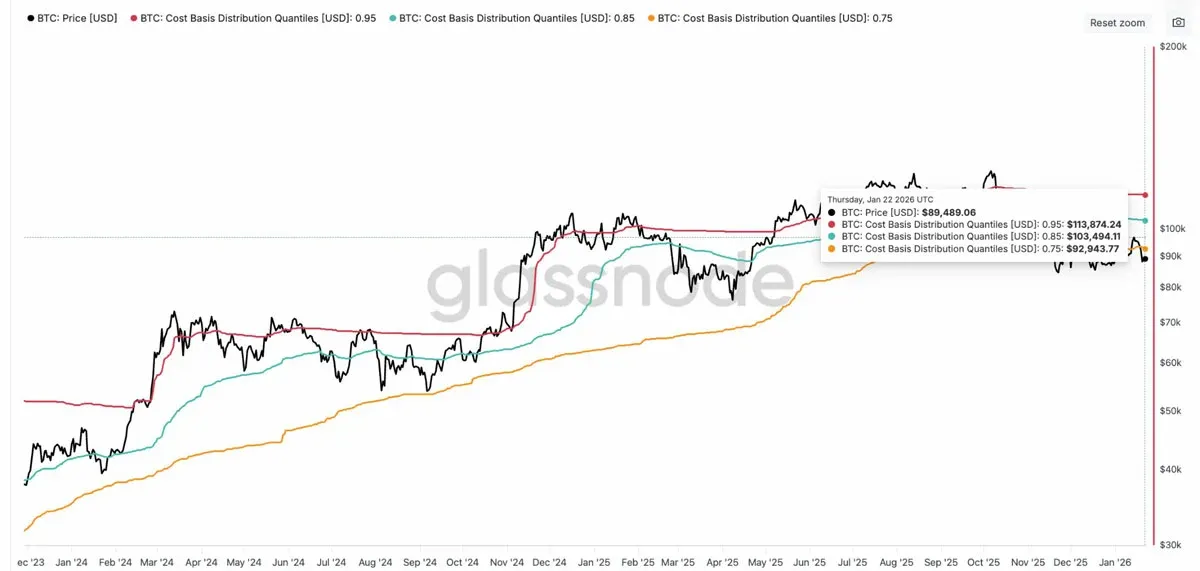
- Trader Merlijn treats the $89,000‑$90,000 corridor as the support line of an upward trend; a failure there could see price retest the $84,000 vicinity.
- A cost‑basis heatmap reveals that roughly 941,651 BTC were purchased around this price in the past six months, underscoring its support character.
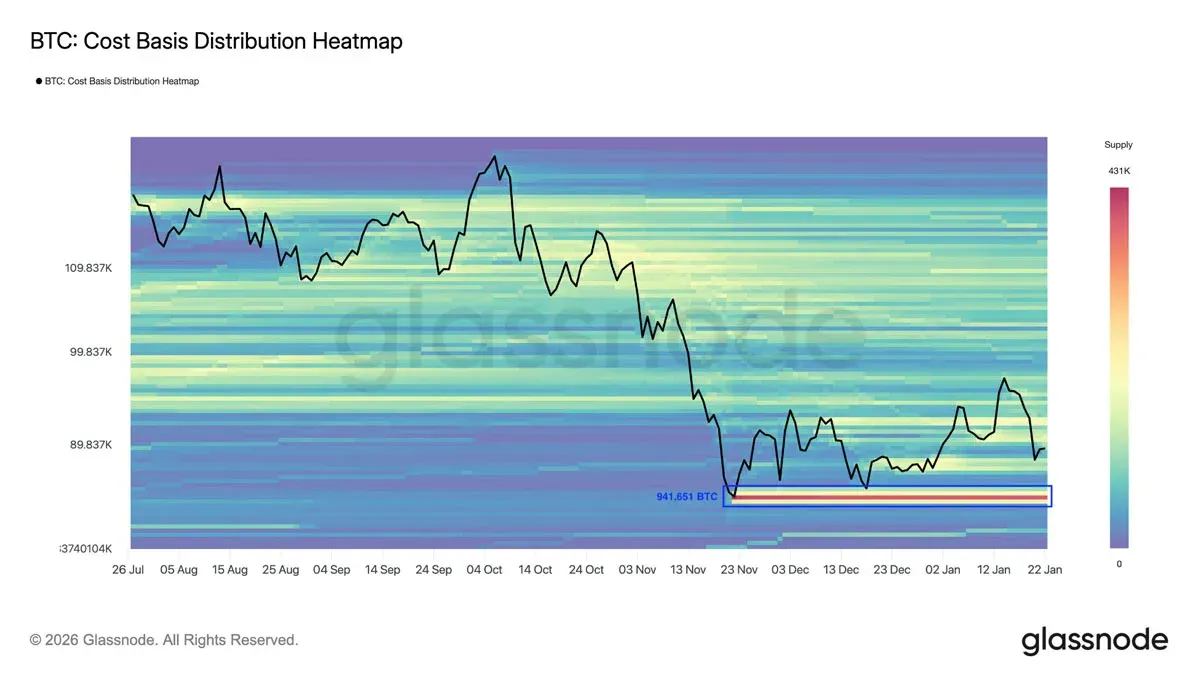
- An even lower critical support appears near $80,000, where more than 127,000 BTC have accumulated buying interest.
Several analysts point to a confluence of weak derivatives activity, long‑term holder liquidation, and bitcoin transfers to exchanges as factors that could keep the price on a downward trajectory throughout the year.
Bitcoin’s Profit‑Cycle Turns Negative
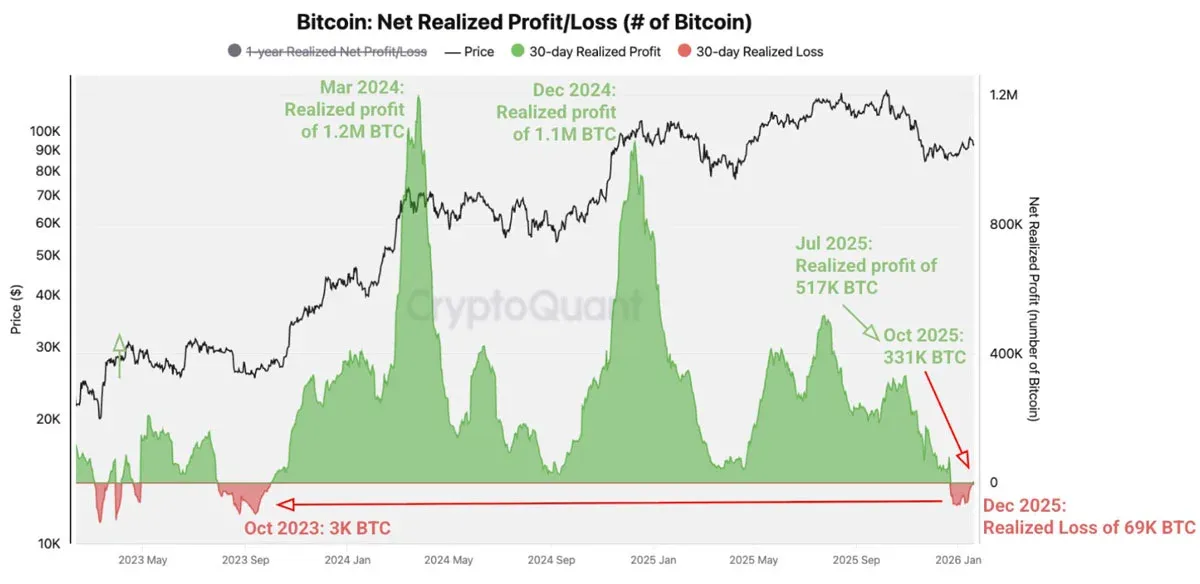
Since the start of 2023, Bitcoin’s profit‑cycle has entered negative territory for the first time, a hallmark of an early bear market.
In the Weekly Crypto Report released on 22 January, on‑chain data provider CryptoQuant reported that Bitcoin holders experienced a net loss for the first time in over two years.
During the past 30 days, the cumulative realized profit/loss (net realized profit) locked in by investors when moving coins on‑chain fell to ‑69,000 BTC, signalling a clear erosion of market momentum.
“The net loss first appeared in October 2023,” a CryptoQuant analyst wrote, adding, “Since March 2024, the peak of realized profits has been steadily declining, indicating that the bull market has ended and price upside has faded.”
At the same time, annual net realized profit dropped from 4.4 million BTC in October to 2.5 million BTC, a level last seen in March 2022.
Analysts say this further validates the view that “on‑chain profit dynamics now mirror an early‑bear‑market pattern.”
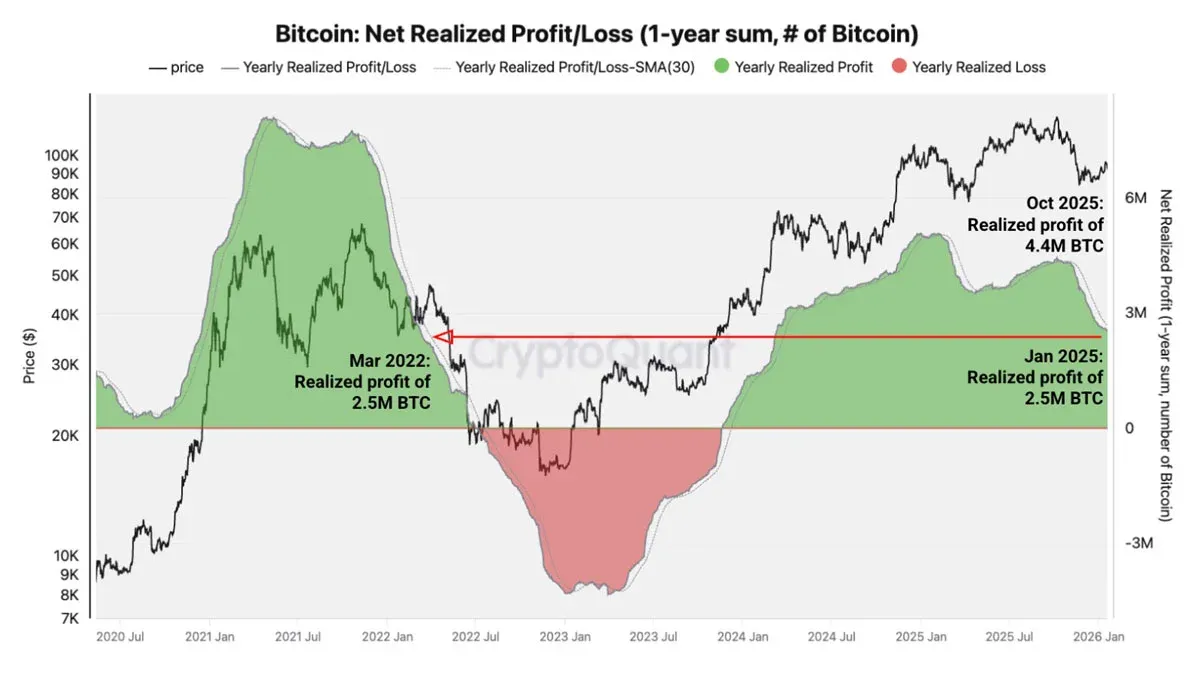
The trajectory closely resembles the 2021‑2022 transition from a bull to a bear market: profit peaked in January 2021, followed by a series of lower highs throughout the year, eventually turning negative before the 2022 bear market fully set in.
Multiple market observers forecast that 2026 could usher in a new bear phase, with some models projecting Bitcoin to dip toward $58,000.
Titan’s post on X states, “Bitcoin has issued a bearish signal,” and points out that the MACD has produced a bearish crossover over the past two months.
“Historically, configurations like this have preceded pull‑backs of roughly 50 %‑64 %.”
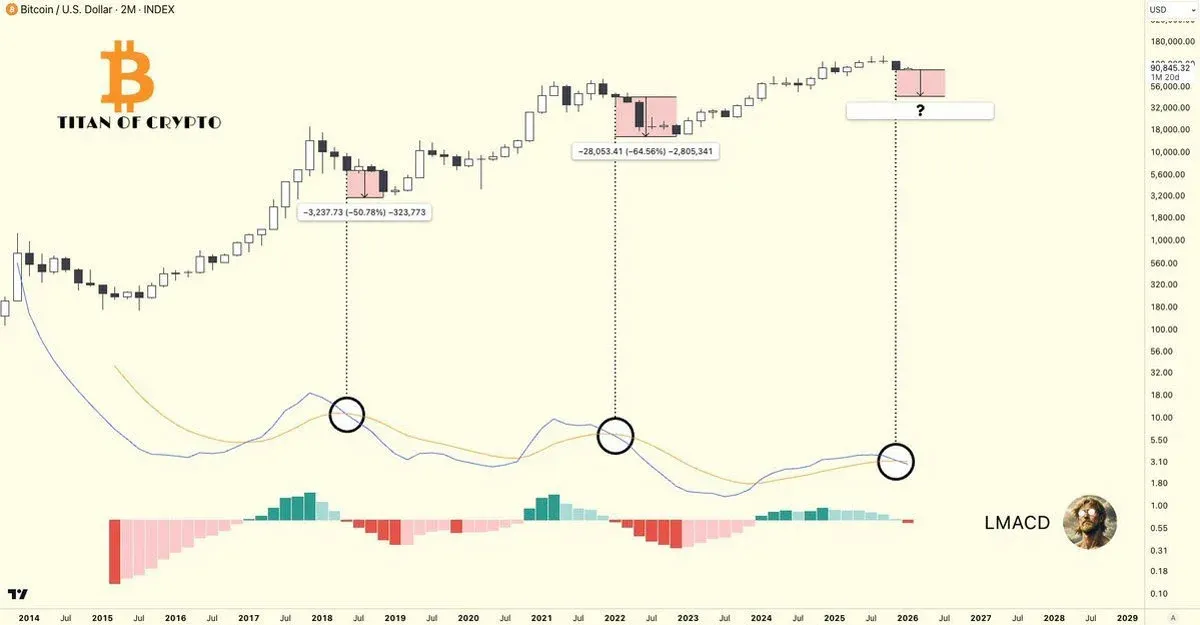
BTC/USD two‑month chart. Source: major cryptocurrency data provider
---
In summary, Bitcoin appears to be in an “early bear market” stage, with the $84,000 support zone playing a decisive role for future price action. For deeper analysis of the Bitcoin bear market and critical price levels, follow the upcoming reports from Bitaigen (比特根).
*Note: Cryptocurrency transactions may be subject to tax in your local jurisdiction; consider consulting a tax professional. For U.S. residents, trades on Binance should be conducted via Binance.US, while international users can use the global Binance platform and settle fiat via SEPA or SWIFT as appropriate.*
Related Reading
- BTC rebounds to $71,500; derivatives skew signals caution
- Xapo Bank Launches Bitcoin‑Backed USD Loans for Holders
- Is Bitcoin Illegal in China? Myths, Facts & Legal Reality
💡 Register on Binance with referral code B2345 for the maximum trading fee discount. See Binance complete guide.



