
 Bitaigen Research
In this article we outline Bitcoin’s recent technical pattern, focusing on the current key support level and the downside risks that could be triggered. By dissecting market turnover data and macro‑economic indicators, we aim to help readers assess the likely price corridor and directional bias for the coming sessions. Subsequent sections will provide a more granular view of potential moves and possible response strategies, so a careful read is recommended.
Current Technical Landscape and Key Support
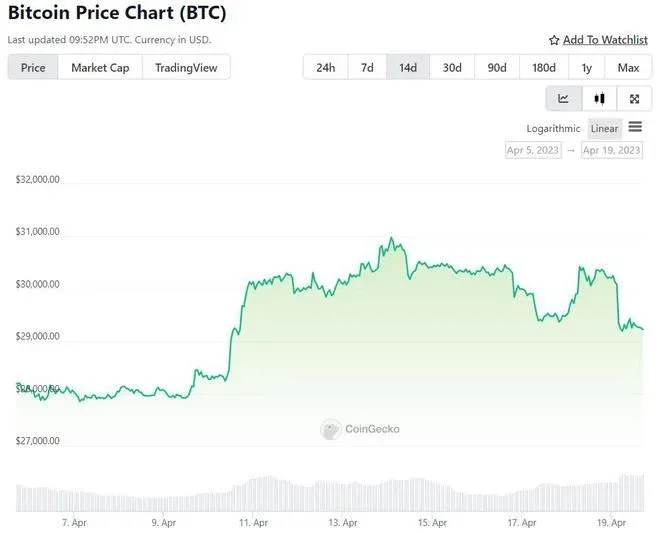
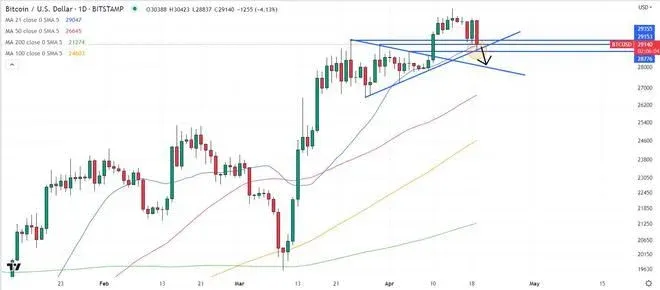
Bitcoin is fighting to stay above its $29,043 21‑day moving average, a psychological threshold widely regarded as a crucial defensive line. At the same time, the high reached at the end of March through early April—roughly $28,780 – $29,380—has carved out a clear support zone. As long as the price remains above this band, short‑term downward pressure is relatively limited.
If the market pierces this key support, the price could accelerate toward the $28,000 region, entering a more pronounced bearish channel.
Recent Price Decline and Catalysts
On Wednesday, Bitcoin suffered a noticeable pull‑back, closing just shy of $29,000 with a single‑day drop of about 4.5 %, potentially marking its worst performance since March 9. Analysts point to large sell orders on Binance (U.S. users should use Binance.US) and UK inflation data that came in above expectations as the primary external drivers of the move.

Futures Long‑Position Liquidations
Despite the price dip, data from Coinglass shows that the liquidation value of leveraged Bitcoin futures long positions remains just above $40 million. This suggests that even after the month’s peak, short sellers have not generated massive liquidation pressure on longs.
Potential Lower Targets
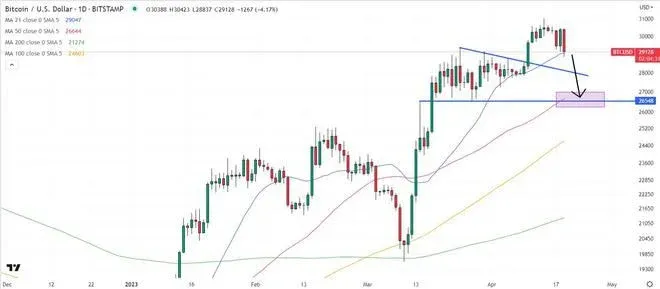
- Should the $28,000 barrier be breached, the next objective could be near $26,500, a level that aligns with the 50‑day moving average support and represents roughly an 8 % correction from current levels.
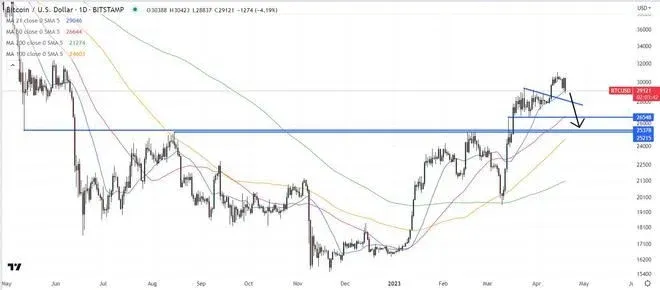
- A deeper support zone lies in the $25,200 – $25,400 range.
- If Bitcoin continues to slide toward $20,000, it may create an opportunity for long‑position entrants, especially for investors who missed the rebound that began in March when the price was still below $20,000.
Long‑Term Trend and Macro Context
While short‑term volatility remains a concern—and history shows Bitcoin can undergo rapid corrections of around 20 % (for example the late‑February to early‑March swing)—on‑chain metrics continue to emit positive signals, hinting that the asset may be entering the early phase of a new bull market. Looking back, last year’s $15,000 low is widely regarded as the bottom of the previous bear market, offering a reference point for today’s price corridor.
On the macro side, the overall environment in 2023 has been relatively supportive for Bitcoin. Although the Federal Reserve may implement one or two more rate hikes in the near term, expectations are shifting toward a rate‑cutting cycle in the second half of the year as policymakers respond to recession risks. Such a move could bolster liquidity for digital assets. For fiat deposits and withdrawals, global users typically rely on SEPA or SWIFT transfers.
Tax reminder: Gains from cryptocurrency transactions may be subject to tax in your jurisdiction. It is advisable to consult a local tax professional to ensure compliance.
Options Market View on Downside Risk
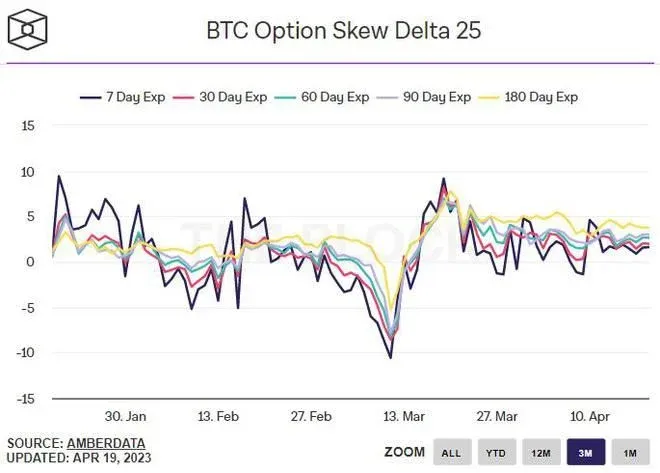
At present, the Bitcoin options market appears less fearful of a steep decline. Across contracts expiring in 7, 30, 60, 90, 180 days, the 25 % delta skew remains positive, indicating that investors are more willing to pay premiums for call options rather than puts. This reflects a lingering optimism about upside potential in the market.
Related Reading
- Bitcoin Price Forecast: Technical, On‑Chain & Macro Factors
- Bitcoin (BTC) 10-Year Price Review & Future Outlook
- Bitcoin 2024 Outlook: Central Banks, Hedge Funds & Industry
💡 Register on Binance with referral code B2345 for the maximum trading fee discount. See Binance complete guide.



