
 Bitaigen Research
 We have compiled the latest Bitcoin market movements for you, focusing on today’s price fluctuations, market capitalization changes, and circulating supply variations, and we provide real‑time data comparisons. Through charts and multi‑time‑frame performance metrics, readers can quickly grasp market dynamics. Subsequent sections will explore influencing factors and short‑term trends, so a thorough read is recommended.
Bitcoin Price Today – Chart Analysis
Bitcoin price today: $42,157.70
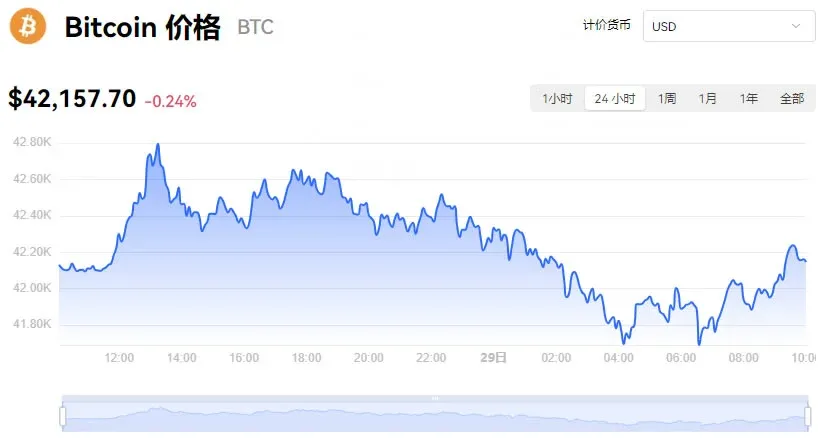
On January 29 2024, Bitcoin (BTC) was quoted at $42,157.70 in the USD market, down 0.24 % from the previous trading day. The market capitalization was approximately $826.937 billion, with a circulating supply of about 19.6118 million BTC.
Bitcoin Real‑Time Data
- Current price: $42,157.70
- 24 h change: ‑0.24 % (‑$102.80)
- Market‑cap rank: #1
- Real‑time market cap: $826.937 billion
- Circulating supply: 19.6118 million BTC
- Max supply: 21 million BTC
We will continuously sync the latest BTC/USD quote.
Bitcoin Price Performance (USD)
| Time frame | Price change | Percentage change |
|---|---|---|
| Today | **‑$102.80** | **‑0.24 %** |
| 7 days | **+$790.00** | **+1.91 %** |
| 30 days | **‑$8.70** | **‑0.02 %** |
| 3 months | **‑$300.10** | **‑0.70 %** |
Today’s Bitcoin to Chinese Yuan Exchange Rate
1. Bitcoin / CNY
- 1 BTC = 298,554.791666 CNY
- Rate timestamp: 2024‑01‑29 09:01
At the current rate, 1 Bitcoin can be exchanged for roughly 298,554.79 CNY.
2. CNY / Bitcoin
- 1 CNY = 0.000003 BTC
- Rate timestamp: 2024‑01‑29 09:01
At the current rate, 1 Chinese yuan can be exchanged for about 0.000003 BTC.
Bitcoin Historical Price Chart (2010‑2021)
2010‑2011: Genesis Block to the First Exchange
- In 2009, Satoshi Nakamoto created Bitcoin; the first real‑world transaction occurred on May 22 2010, when 10,000 BTC were exchanged for two pizzas.
- In July of the same year, the inaugural exchange Mt. Gox launched, listing Bitcoin at roughly $0.05. The price then rose steadily to $0.39 between July and November.
2012‑2013: First Major Bull Run
- Throughout 2012, the price fluctuated between $2 and $13.
- Starting at the end of January 2013, the price surged, reaching $266 on April 10, a gain of more than 20 ×.
- On May 14, Mt. Gox’s daily trading volume surpassed $100 million.
- At the end of 2013, the People’s Bank of China issued its first Bitcoin warning, labeling it an “illegal trading activity.”
2014‑2015: Price Corrections
- In early 2014, Bitcoin fell below $800; the bankruptcy of Mt. Gox in October pushed the price further down to under $200.
- 2015 saw a gradual rebound, with Bitcoin trading in the $200‑$300 range.
2016‑2017: Second Massive Surge
- Throughout 2017, Bitcoin rallied from roughly $1,000 to an all‑time high of about $20,000, an increase of around 20 ×.
- Starting in December 2017, the price entered a rapid decline, shedding more than 80 % over the next year and slipping below $3,500 by early 2019.
2018‑2022: Volatile Oscillations
- In 2018‑2019, Bitcoin hovered near $10,000, then experienced a sharp correction.
- In March 2020, amid the COVID‑19 pandemic, the price dropped below $3,800.
- Early 2021 saw a breakout past $60,000, but a series of macro‑economic and regulatory factors triggered a pull‑back, leaving the 2022 price range highly volatile.
Top Ten Bitcoin Trading Platforms
- OKEx – Hub for major players in the crypto space
- Huobi – Exchange with the highest retail activity
- Coinbase (U.S.) – Most internationally recognized platform
- BitMEX (Hong Kong)
- ZB – Often referred to as “ZB.com”
- Bitfinex
- Gate.io
- Coinbase – Re‑listed to preserve the original ordering
- MXC (also known as “Mochi”)
- AOFEX – “A‑Network” exchange
The above constitutes the Bitcoin price today chart analysis (January 29 2024) and related information. For additional Bitcoin resources, please follow Bitaigen (比特根) and explore other related articles.
💡 Register on Binance with referral code B2345 for the maximum trading fee discount. See Binance complete guide.



