
 Bitaigen Research
Bitcoin attempted to retake the critical $65,000 support level when Wall Street opened on Wednesday, then surged past $66,000. Rumors that U.S. institutions might be applying pressure have also begun to swirl.
In this article we break down the key drivers behind Bitcoin’s recent strong rebound, focusing on how the rumored actions of a well‑known Wall Street trading firm could be shaping market sentiment. By combining order‑book depth analysis with on‑chain data, we aim to help readers pinpoint the real forces behind the volatility. After a thorough look, you should have a clearer view of what may lie ahead.
Key Takeaways
- BTC has recovered roughly 2.5 % in the short term, amid circulating rumors that Wall Street trading house Jane Street could be exerting downward pressure on the price.
- Jane Street firmly denies accusations that it manipulated the crypto market during the 2022 bear market.
- An unusually “thin” exchange order book has amplified Bitcoin’s price swings.
Bitcoin Community Debates Jane Street’s “10 AM Price Crash”
TradingView data captured Bitcoin on the Bitstamp pair spiking to $66,300 before entering a consolidation phase.
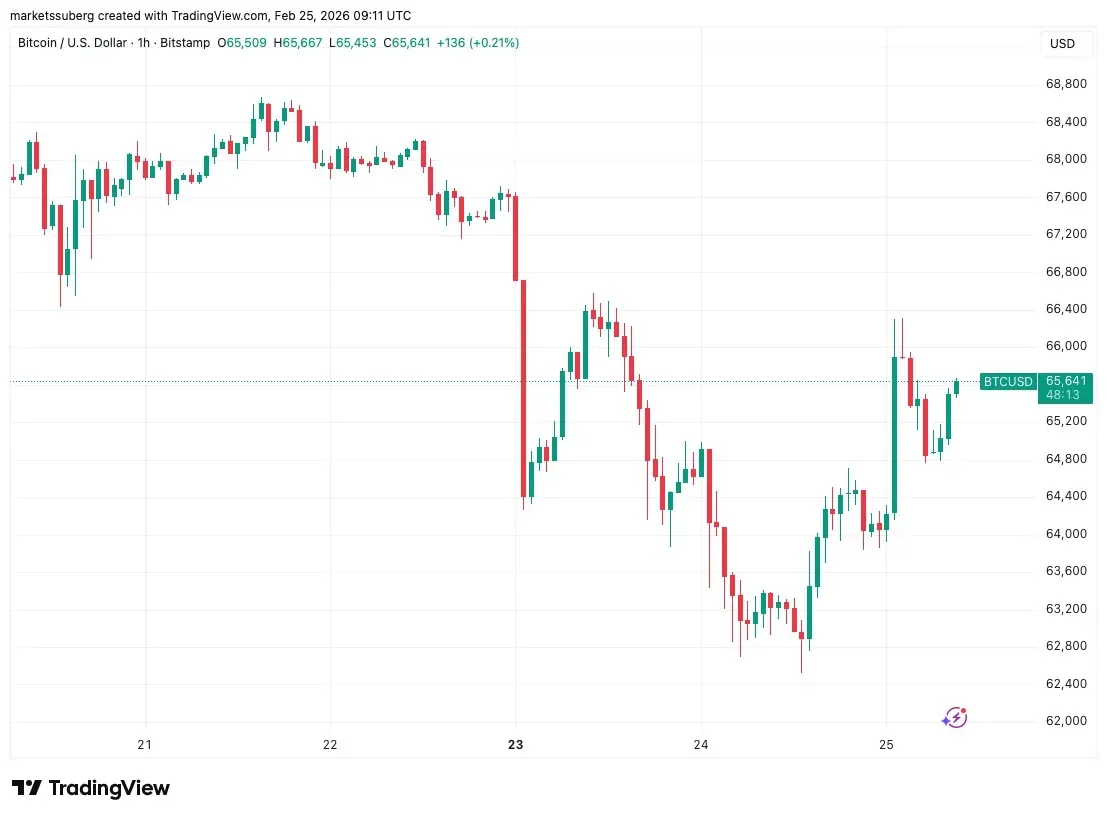
On an intraday basis, BTC/USD’s gain has stayed above 2 %, prompting more participants to wonder whether any deliberate price‑suppression tactics are at play.
One narrative circulating on social media points to a mysterious quant firm—Jane Street. The firm is currently entangled in legal disputes stemming from a lawsuit filed by the now‑defunct Terraform Labs.
According to the claim, a coordinated algorithmic sell‑off at 10 a.m. Eastern Time has become a key factor behind Bitcoin’s steady decline since October 2025.
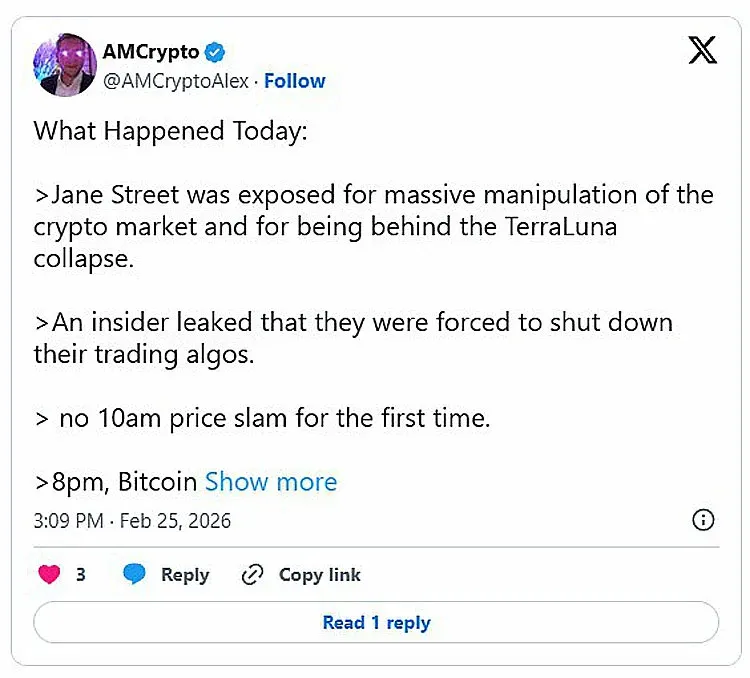
If the litigation drags on, Jane Street may be forced to pause its trading strategy temporarily, which could lift market prices further.
Terraform Labs’ complaint specifically cites “market manipulation” throughout 2022 that had a material impact on crypto assets—an year when Bitcoin bottomed in Q4 at roughly $15,600.
When asked by *Cointelegraph*, Jane Street stressed that the allegations are “baseless and purely speculative.”
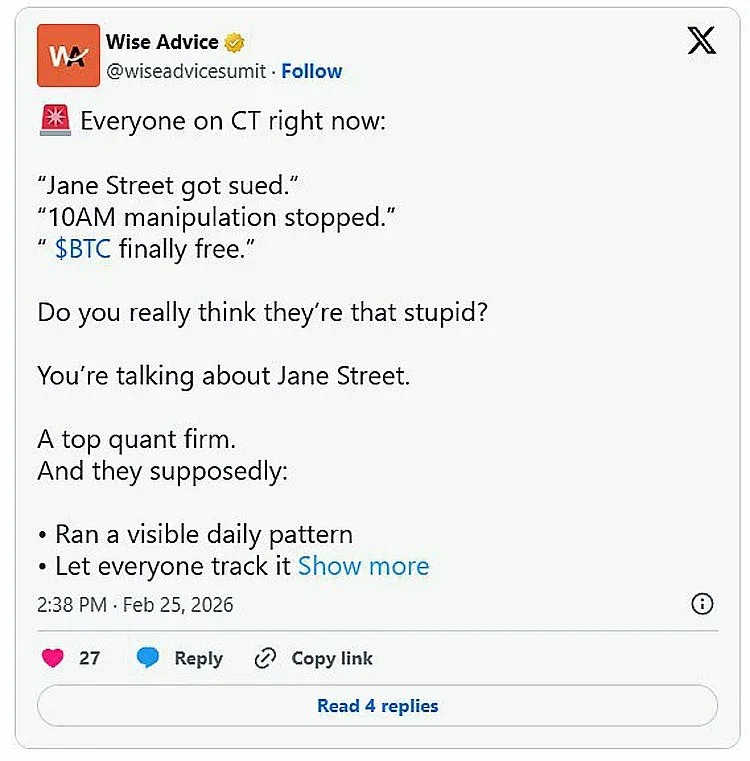
At the same time, not everyone is convinced by the 10 a.m. sell‑off theory. Crypto YouTuber “Wise Advice” argued that the explanation is overly simplistic and lacks solid evidence.
Bitcoin Price and “Extremely Sparse” Liquidity
In light of recent volatility, traders remain cautious.
On X, analyst Jelle wrote: “$BTC is facing a notable resistance around $66,000—derived from a local swing‑low and the intersection of the 4‑hour trend line.”
“A short‑term reversal may provide temporary relief, but the broader trend is fairly clear; avoid trading against it.”
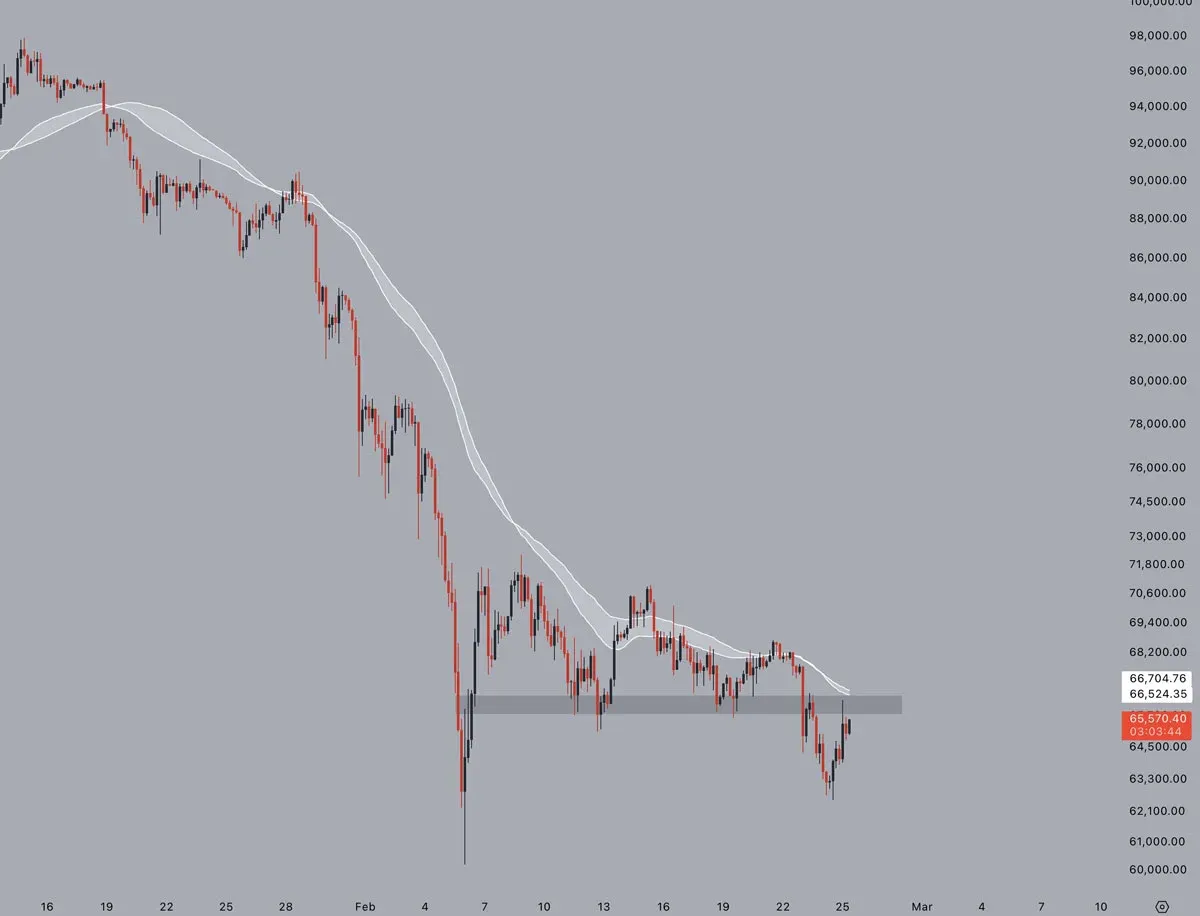
The BTC/USD 4‑hour chart displays the technical signals mentioned above. Source: Jelle/X
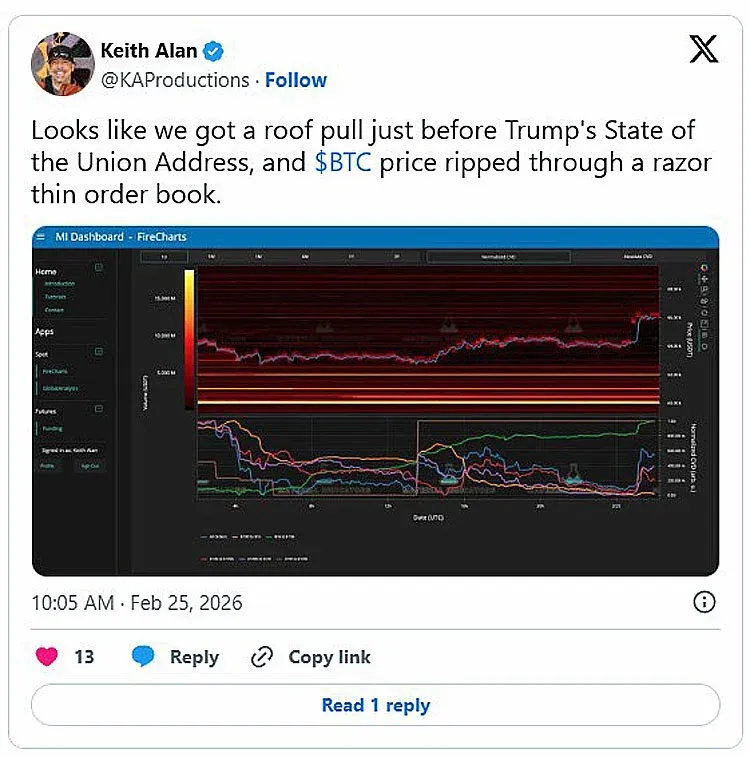
Keith Allen, co‑founder of Material Indicators, believes that the “extremely thin order book” on exchanges is the primary catalyst for the current rebound.
He posted on X: “The market had already priced in the upward selling pressure before President Trump delivered his State of the Union address.”
According to data from CoinGlass, at the time of writing the total crypto liquidations over the past 24 hours have reached $333 million, with short‑position contracts accounting for about $213 million.
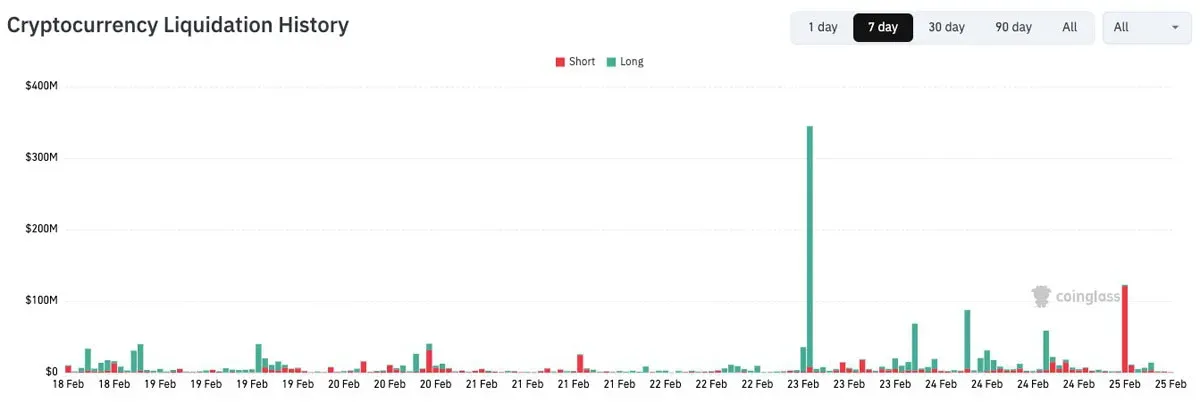
The visualised liquidation history indicates a tight link between market swings and large‑scale position closures. Source: CoinGlass
In summary, as Bitcoin breaks through the $66,000 threshold, rumors surrounding Jane Street’s algorithmic sell‑offs have resurfaced. For deeper analysis of this rebound and related developments, follow Bitaigen’s ongoing coverage.
*Note for U.S. readers: when purchasing fiat (USD, SEPA/SWIFT) on crypto platforms, use Binance.US rather than the global Binance site.*
Related Reading
- How U.S. Treasury Bonds Drive Bitcoin (BTC) Price Volatility
- Bitcoin Price Forecast 2026: Market Trends, Technical Patterns & Key Influences
- Buy Bitcoin with PayPal FAQ: Purchase, Transfer & Wallet Limits
💡 Register on Binance with referral code B2345 for the maximum trading fee discount. See Binance complete guide.



