
 Bitaigen Research
From a technical and liquidity perspective we analyse what the Bitcoin weekly RSI nearing historic lows implies, explain why the market has entered a fierce liquidity‑fighting phase, and combine that with the consolidation paths of previous bear markets to offer a reference framework for future price action. Read the full article to understand potential turning‑point signals and key risk considerations.
Bitcoin RSI hints at an upcoming “cycle low”
Material Indicators co‑founder Keith Alan points out that the current weekly Relative Strength Index (RSI) is closing in on the oversold zone observed during the 2022 bear market, suggesting that Bitcoin may be in a bottom‑testing phase.
“The weekly RSI is now at 27.8, the lowest level since June 2022. Values below 30 are typically regarded as oversold.”
— *Keith Alan (X)*
He adds a cautionary note that this does not guarantee a repeat of the 2022 price trajectory, but comparing historical patterns with today’s deviation can still provide useful guidance for the coming weeks.
“Similar lows appeared in 2015 and 2018, yet it was the prolonged five‑month sideways consolidation after the 2022 dip that truly confirmed the bottom.”
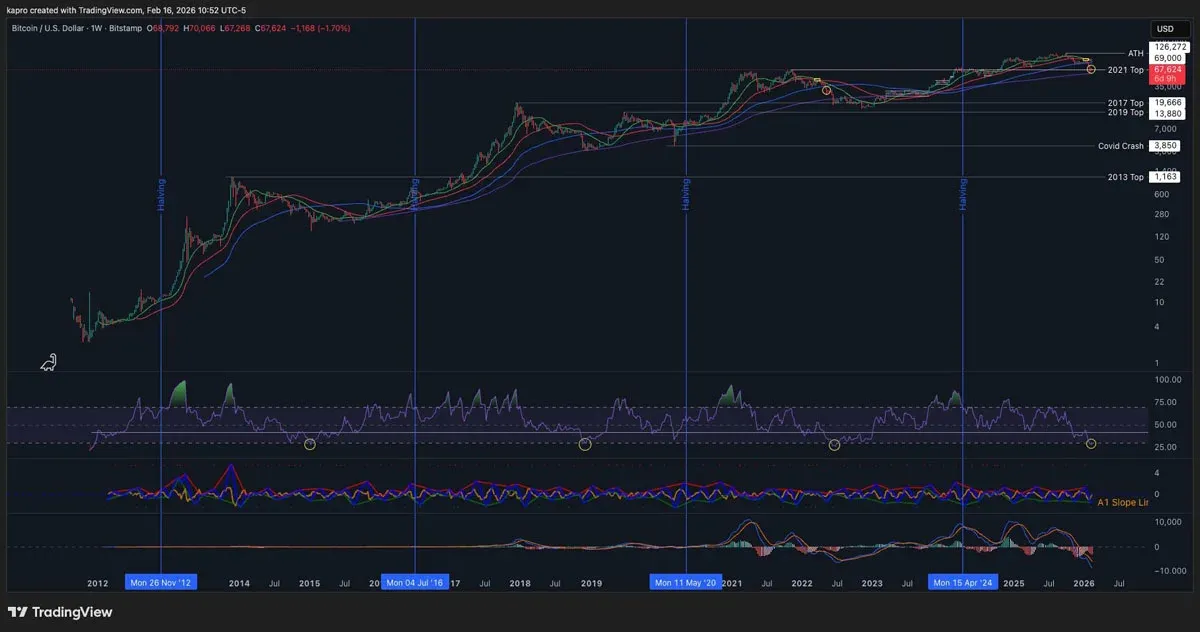
*BTC/USD weekly chart with RSI data. Source: Keith Alan/X*
BTC price liquidity tightening, weeding out traders
Data from TradingView shows that during U.S. public holidays (e.g., President’s Day) Bitcoin’s price has swung sharply within a relatively narrow range, at one point touching $70,000.
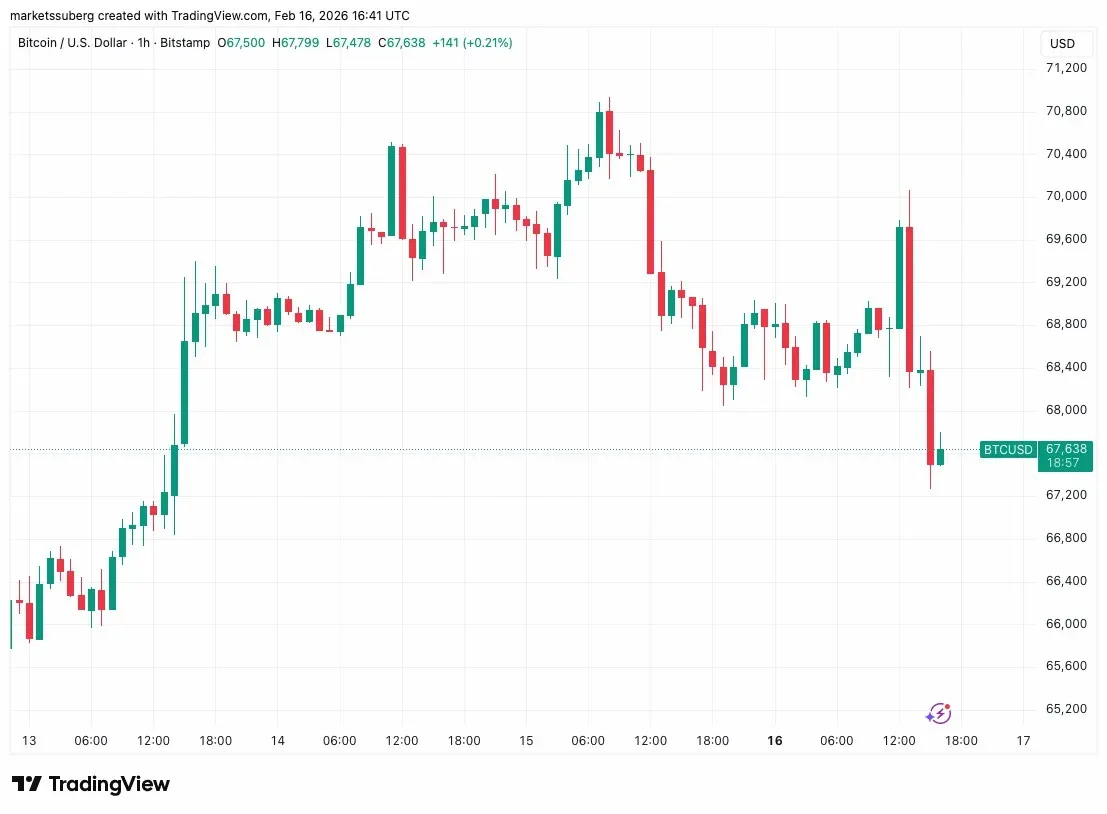
*BTC/USD hourly chart. Source: Cointelegraph/TradingView*
Holiday closures on Wall Street caused the order book to become thin, allowing large‑scale capital to move short‑term prices more easily. The resulting series of “short‑squeeze” events have impacted both long and short positions.
CoinGlass monitoring indicates that, at the time of writing, the total amount of liquidations across the crypto market in the most recent four‑hour window has already reached $120 million.
Bid‑ask spreads were cleared rapidly; after the price retraced, a new resistance level formed immediately above, adding further downward pressure.
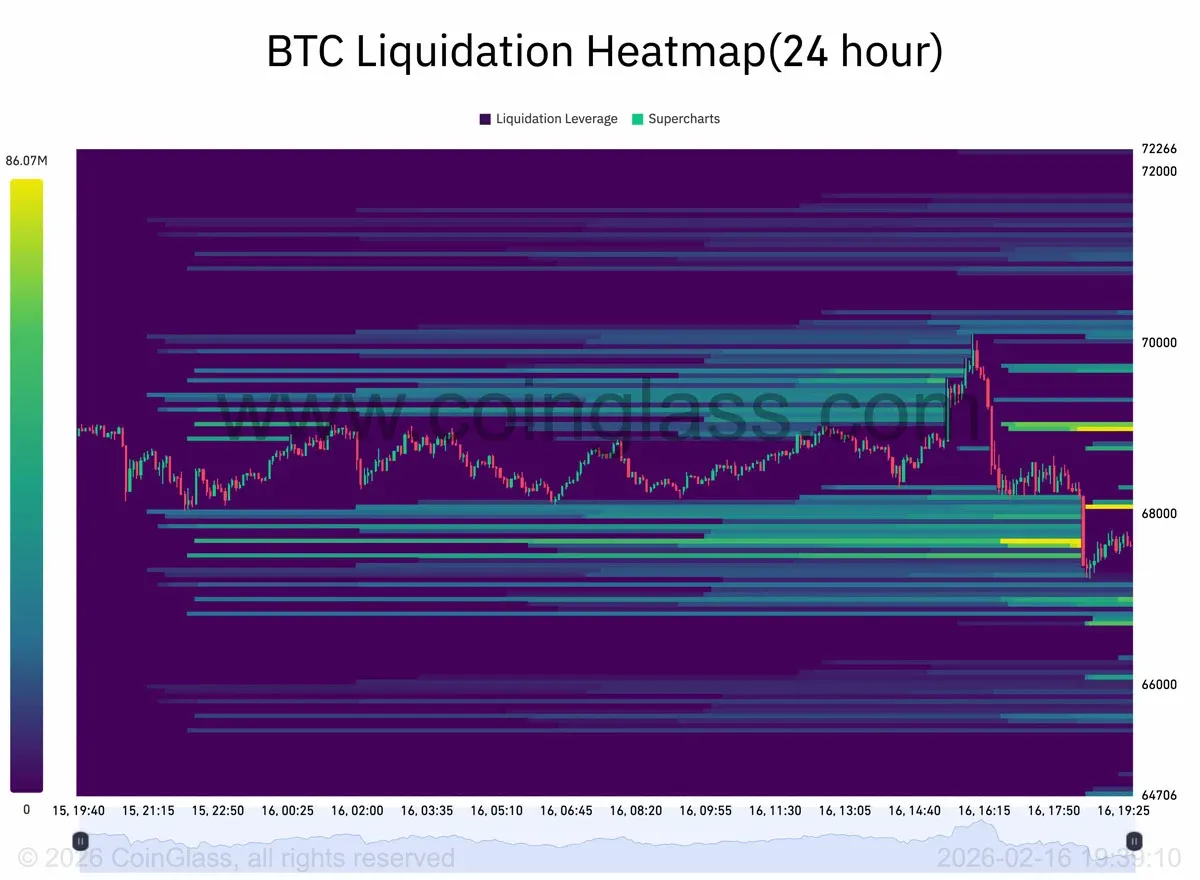
*Bitcoin liquidation heatmap. Source: CoinGlass*
Trader Daan Crypto Trades commented on X:
“Volatility has clearly spiked, and we see the same pattern across almost every other market. Global markets are currently in a relatively turbulent phase.”
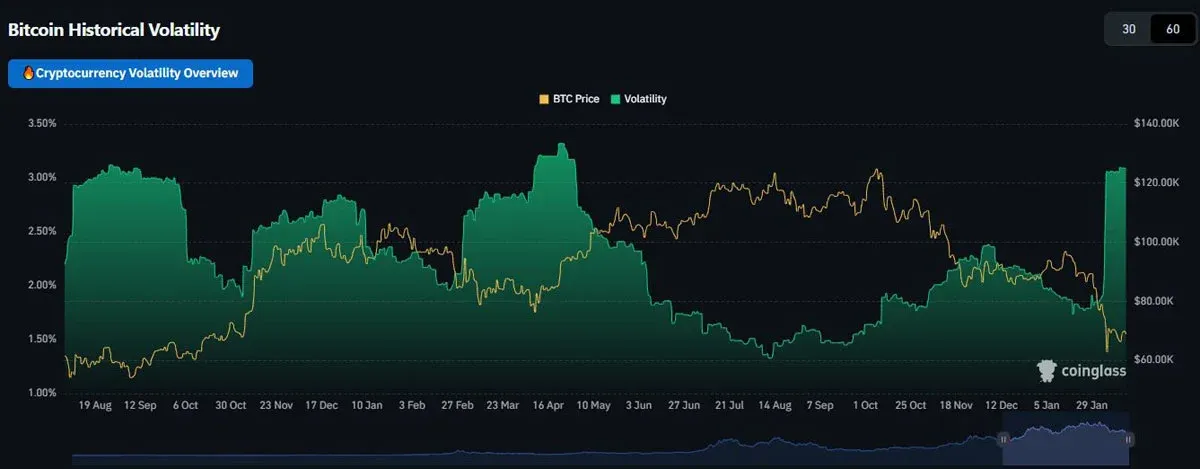
*Bitcoin historical volatility. Source: Daan Crypto Trades/X*
Material Indicators describes the present price action as “breakout‑and‑consolidation.” The accompanying chart illustrates liquidity on the Binance BTC/USDT pair (U.S. users should use Binance.US) together with whale activity metrics.
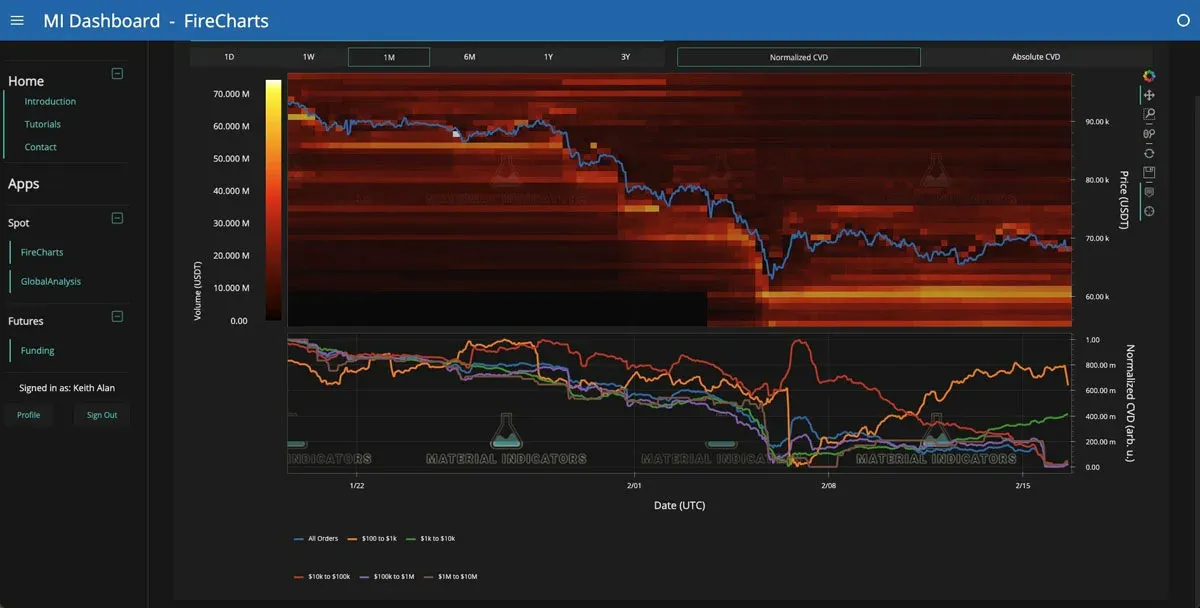
*BTC/USDT order‑book liquidity data with whale volume. Source: Material Indicators/X*
Another trader, CW, observed that, aside from OKX, buying pressure on all other platforms strengthened after Sunday.
“Compared with yesterday, net buying of $BTC remains strong on every platform except OKX.”
— *CW (@CW8900) 2026‑02‑16*
Key takeaways
- During U.S. bank holidays, short‑term market behaviour significantly influences the positioning of both bulls and bears.
- BTC price exhibits a “breakout‑then‑consolidation” pattern, yet it remains confined within a relatively narrow range.
- The current RSI level evokes the intermediate low of the 2022 bear market and therefore warrants continued observation.
This analysis outlines why Bitcoin’s (BTC) weekly RSI is nearing the mid‑2022 bear‑market level and why liquidity competition has become fierce. For more in‑depth coverage of Bitcoin’s weekly RSI and market dynamics, follow Bitaigen (比特根) for future updates.
*Note: Cryptocurrency gains may be taxable in your jurisdiction; please consult a qualified tax professional. For fiat transactions, use USD via SEPA or SWIFT where applicable.*
Related Reading
- Bitcoin Enters Early Bear Market; $84K Support Crucial
- BTC rebounds to $71,500; derivatives skew signals caution
- Xapo Bank Launches Bitcoin‑Backed USD Loans for Holders
💡 Register on Binance with referral code B2345 for the maximum trading fee discount. See Binance complete guide.



