
 Bitaigen Research
 Solana’s recent trading‑volume performance has been eye‑catching, yet it still has not fully overtaken all EVM chains, especially lagging behind Ethereum when it comes to deep liquidity pools.
In this article we conduct an in‑depth analysis of Solana’s recent trading performance and ecosystem status, combine mainstream industry metrics, and assess whether it truly surpasses traditional EVM chains in technology and liquidity. By applying a rigorous methodological framework, we aim to help readers make a rational judgment about its development potential. Subsequent sections will reveal the key comparative factors, so a careful read is worthwhile.
Note: Users located in the United States should access crypto services through Binance.US rather than the global Binance platform. Additionally, cryptocurrency gains may be subject to tax in your local jurisdiction, so consider applicable tax obligations.
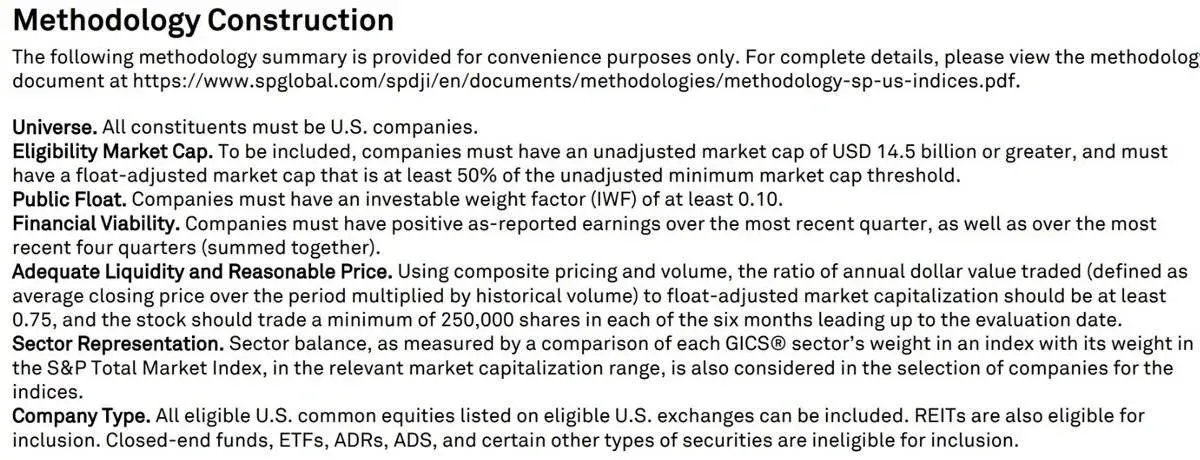
Methodology Construction
The following methodology summary is provided for reference only; for complete details please consult the SP Global methodology documentation.
- Scope: All constituent stocks must be U.S. companies.
- Market‑Cap Eligibility: Companies must have an unadjusted market cap of at least $14.5 billion, and the float‑adjusted market cap must be no less than 50 % of the unadjusted minimum‑cap threshold.
- Public Shareholding: The Investable Weight Factor (IWF) must be ≥ 0.10.
- Financial Feasibility: Both the most recent quarter and the most recent four‑quarter cumulative earnings must be positive.
- Liquidity & Price Reasonableness: The annual trading value (average closing price × historical volume) divided by the float‑adjusted market cap must be ≥ 0.75, and each month’s trading volume for the six months preceding the evaluation date must be ≥ 250,000 shares.
- Industry Representation: Measured by comparing the weight of GICS® industries in the index versus the overall S&P market index, selecting companies within the corresponding market‑cap range.
- Company Types: Eligible U.S. common stocks and REITs may be included; closed‑end funds, ETFs, ADRs, ADSs, etc., are excluded.
Are there stocks that trade outside the major indices? The answer is yes.
These stocks constitute the “blue‑chip” segment of traditional finance. Identifying analogous blue‑chip pools in DeFi can help us gauge which targets traditional finance might focus on when entering the DeFi space.
I collected trading‑volume data for Ethereum, Solana, BSC, Arbitrum, and Base across all liquidity pools, and aggregated the total volume for the past 30 days.
Subsequently, I applied a weighting adjustment to pools created within the last 30 days, lowering their rank to satisfy a “established‑history” criterion.
Finally, I weighted each pool’s volume against its TVL (Total Value Locked) using the formula:
```
Ln(TVL) / Ln(MAX(TVL)) * TVL_weight
```
This scaling has a limited impact on pools with abundant liquidity, while it reduces the ranking of pools with comparatively small TVL.
New Top‑20 Pools (Weighted)
- Ethereum, Solana, Arbitrum, and Base each occupy a slot within the top 4.
- All of these pools are primary pairs of the native chain token with USDC.
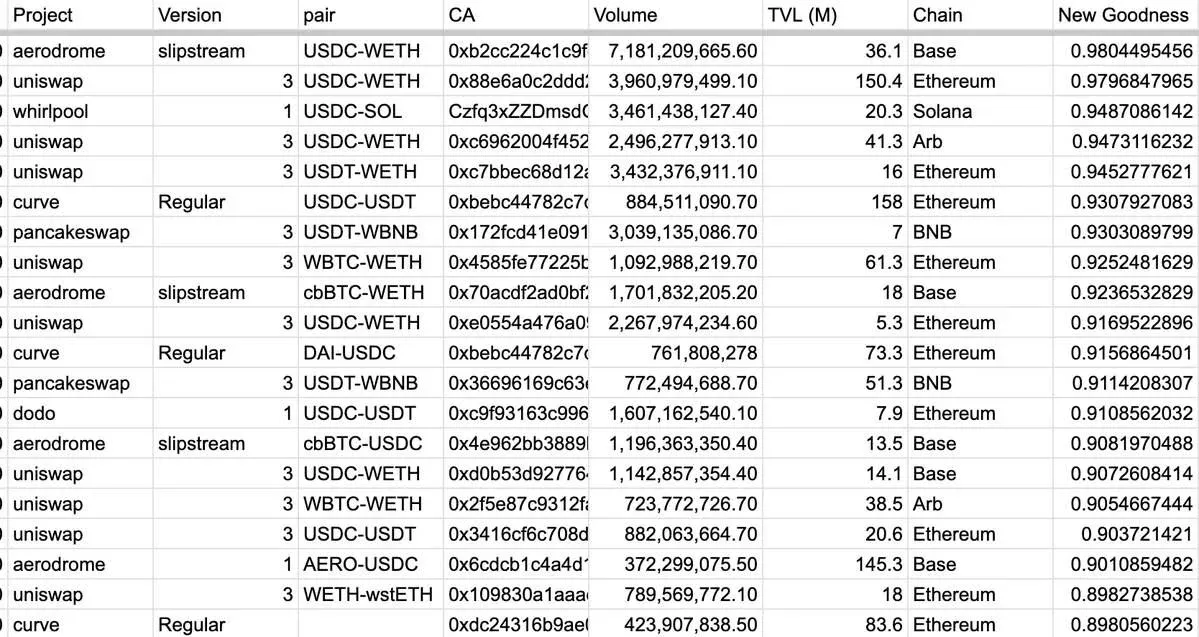
Another striking observation is that Ethereum still dominates, accounting for roughly half of the top‑position slots. Its high TVL combined with sustained trading volume makes it stand out across all chains.
I suspect this is one of the reasons BlackRock chose to deploy capital on Ethereum.
A deeper look shows the first two pools are especially noteworthy:
- The slipstream WETH‑USDC pool on @AerodromeFi records the highest trading volume.
- Uniswap’s v3 WETH‑USDC pool on Ethereum holds the greatest TVL.
Dune data link:
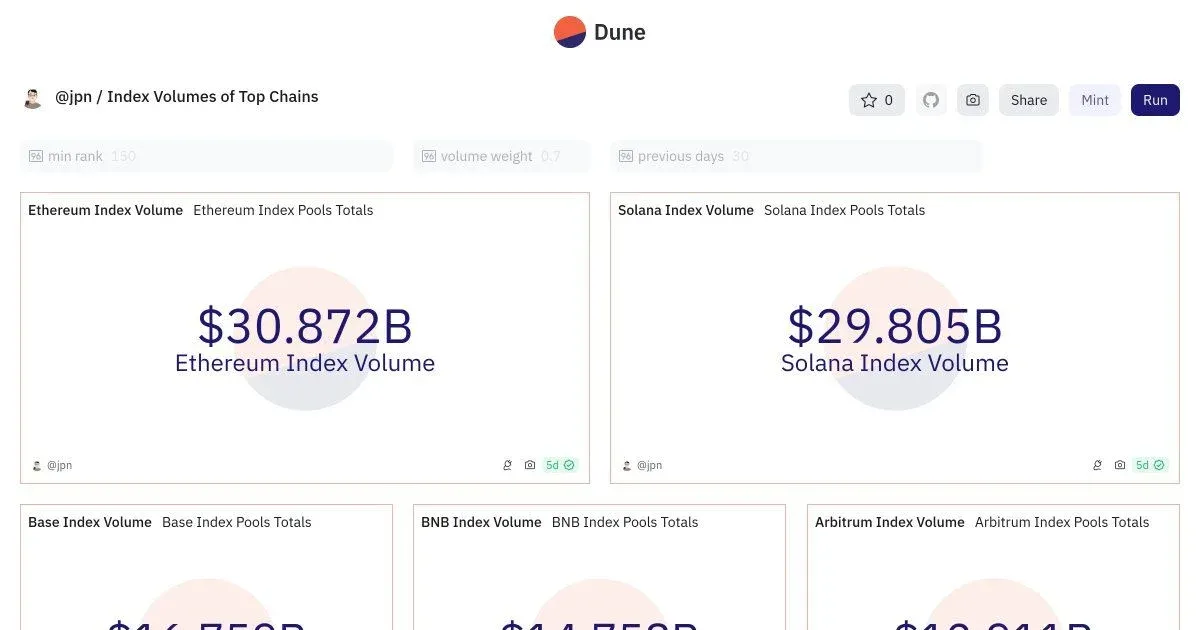
Top Blockchain Trading‑Volume Index
- On most chains, the primary liquidity pools with a 0.05 % fee tier are the top pools; however, on the BNB chain the 0.01 % fee tier pools are the leaders, which is unexpected.
- USDC appears more frequently than USDT in top pools, another surprising result.
Number of Pools per Chain
| Chain | Number of Pools |
|---|---|
| Ethereum | 10 |
| Base | 5 |
| Arbitrum | 2 |
| BSC | 2 |
| Solana | 1 |
In this analysis, aside from the single qualifying Solana pool, the other Solana pools did not make the top list because their TVL was insufficient. Although their trading volumes are sizable, they occur in environments where liquidity is markedly lower than on other chains.
If TVL is ignored, Solana still ranks high in trading volume among the top 150 pools, but it does not surpass all EVM chains, nor does it overtake Ethereum (it only comes close).
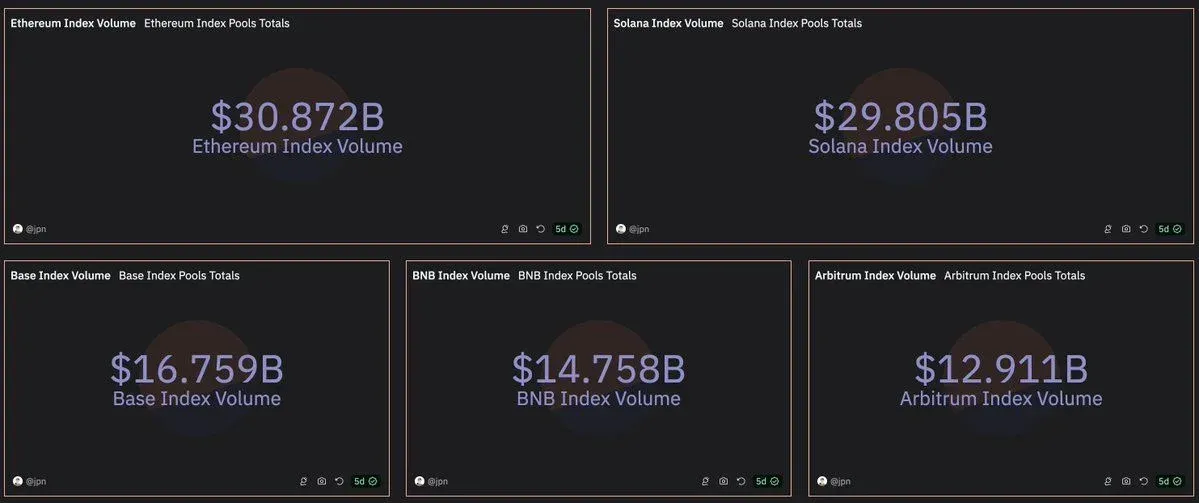
The top 20 assets traded across all pools include:
- Stablecoins: USDC, USDT, DAI, pyUSD
- Major coins: ETH, BNB, SOL, cbBTC, WBTC, wsETH
- Others: AERO
It is worth noting that AERO is the only token that is neither a stablecoin nor among the top‑five market‑cap assets.
TVL of the Top 25 Pools per Chain
| Chain | TVL (USD) |
|---|---|
| Ethereum | $1.04 billion |
| Base | $310 million |
| BNB | $194 million |
| Solana | $181 million |
| Arbitrum | $155 million |
Clearly, Ethereum remains the winner, while Base leads among non‑Ethereum chains.
Furthermore, 4 of the 5 pools on Base belong to Aerodrome, underscoring its strong foothold on that chain—even though Uniswap dominates on Arbitrum and Ethereum.
Summary
- The majority of Solana’s trading volume originates from pools with relatively weak liquidity, a substantial portion of which comes from Pump Fun.
- Ethereum continues to be the DeFi heavyweight, with Base emerging as an unexpected strong challenger that hosts the highest‑volume pool.
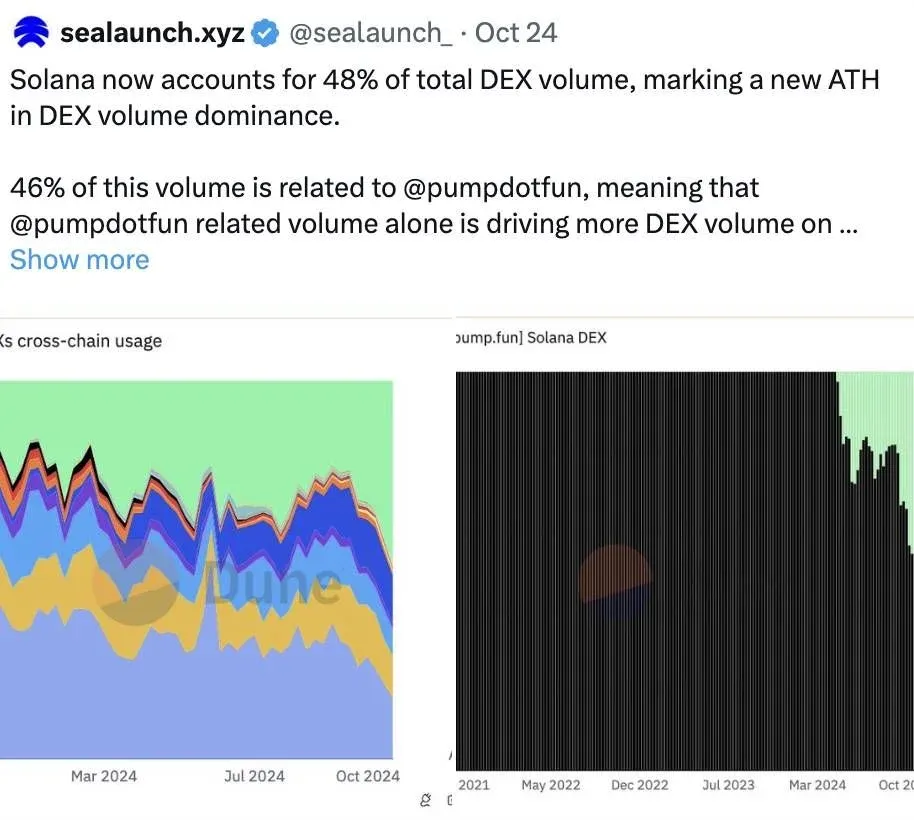
Seasoned DeFi investors tend to focus on sustained economic activity in deep‑liquidity pools rather than short‑term hype surrounding hot tokens.
Potential avenues for further refinement include:
- Automating TVL metric calculations
- Assessing liquidity depth beyond TVL (e.g., capital efficiency of concentrated‑liquidity pools)
- Incorporating pool fee‑tier classifications
I will publish the second part of this analysis in the coming weeks.
The above is Bitaigen’s (比特根) editorial deep‑dive into the question “Has Solana really overtaken EVM chains?” – feel free to read and share!
Related Reading
- XRPL EVM: Ethereum-Compatible Sidechain for DeFi, NFTs
- Ethereum Sharding 2023: Faster Performance, Lower Gas Fees
- Cross-Chain Restaking: Ethereum, Bitcoin & Solana Trends
💡 Register on Binance with referral code B2345 for the maximum trading fee discount. See Binance complete guide.



