 Bitaigen Research
 When researching the optimal timing for Bitcoin investment, veteran investors frequently reference various "on-chain data indicators." This article will begin with the fundamental concepts of MV (Market Value) and RV (Realized Value) to provide an in-depth analysis of their core derivatives: the MVRV Ratio and NUPL. Through these data points, investors can more objectively observe shifts in market sentiment and determine whether Bitcoin prices are currently situated in an overvalued or undervalued range.
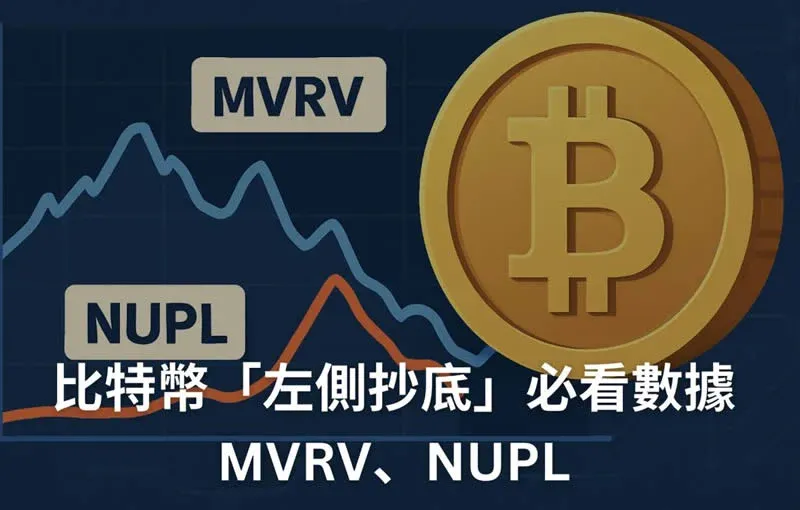
MVRV (Market Value to Realized Value Ratio) and NUPL (Net Unrealized Profit/Loss) are essential on-chain metrics used to assess Bitcoin's valuation. MVRV compares the total market capitalization with the average cost basis of all holders to determine if the price has deviated from its "true" value. Conversely, NUPL reflects the overall profit and loss status of investors across the entire network. When these two indicators reach historically low levels, it typically suggests that the market has entered a bottoming phase, serving as a vital reference for mid-to-long-term strategic positioning.
In the highly volatile cryptocurrency market, simple price action often fails to reveal the full picture. The editorial team believes that the key to piercing through the fog of market sentiment lies in understanding the underlying logic of on-chain data. This article will deeply dissect MVRV and NUPL—two core valuation tools—to reveal the actual profit and loss status of network participants by comparing market value against holding costs. Mastering these indicators can help you establish a more objective analytical framework amidst complex market conditions and identify Bitcoin's cyclical patterns. We recommend readers study these closely to enhance their insight into on-chain data.
What is On-chain Data?
On-chain data refers to public, verifiable information recorded directly on a blockchain network. This data includes every transaction record, the balance of specific wallet addresses, and the flow of tokens between entities. Because blockchains are decentralized and immutable, this information offers a high degree of transparency and is nearly impossible to falsify, making it a powerful tool for observing market heat and capital flows.
On-chain data differs significantly from traditional technical analysis (K-line charts). If "price" is the final result of the battle between supply and demand, then on-chain data is the "behavioral" breakdown behind that result. By observing whether coins are being held for the long term, whether "whales" (large-scale holders) are accumulating in their wallets, or the percentage of the network currently in profit, investors can gain insight into market sentiment and make more rational decisions.
In the global market, investors often move fiat currency into the ecosystem via USD-denominated transfers, such as SWIFT or SEPA for European regions. It is important to note that while global users may use the standard Binance platform, users located in the United States must use Binance.US to comply with local regulatory requirements. Additionally, investors should be aware that cryptocurrency gains may be subject to capital gains tax depending on their local jurisdiction.
Core Bitcoin Indicators: MV, RV, and the MVRV Ratio
The MVRV Ratio was proposed by analysts Murad Mahmudov and David Puell in 2018. It has since become a globally recognized benchmark for identifying Bitcoin’s cyclical stages.
1. What is MV (Market Value)?
MV, or Market Value, is calculated as "Current Price × Total Circulating Supply." This is identical to "Market Cap" in traditional finance. It reflects the market's total valuation of Bitcoin at the current moment in USD and is heavily influenced by short-term emotional fluctuations and speculative trading.
2. What is RV (Realized Value)?
RV, or Realized Value, offers a more nuanced perspective. Because the Bitcoin ledger records the movement of every single Satoshi, we can calculate the price of each Bitcoin at the time it was "last moved" on-chain. By summing the value of all Bitcoins at their last movement price and dividing by the supply, we arrive at the RV. RV is widely regarded as the "average cost basis" for the entire network of holders.
3. What is the MVRV Ratio?
The MVRV Ratio is the quotient of MV divided by RV. It represents the degree of premium (or discount) of the current market price relative to the average acquisition cost of all holders.
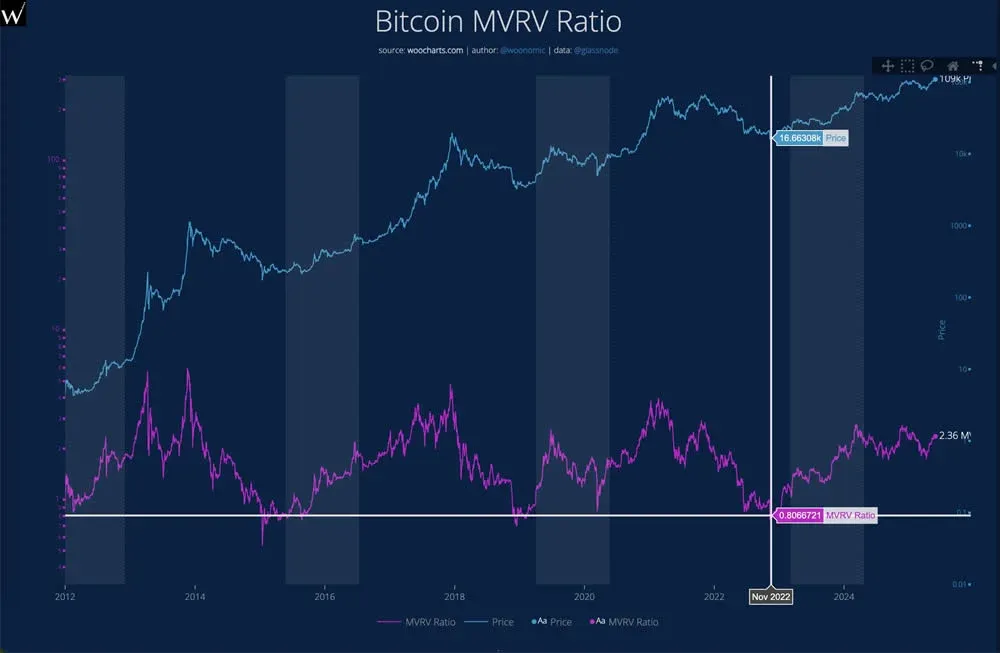
Historical Data Reference: MVRV Ratio Entry and Exit Signals
Based on historical cycles, investors often use the MVRV Ratio to assist in formulating their investment strategies:
- Undervaluation Range (Buy Reference): When the MVRV Ratio < 1, it means the current market capitalization is lower than the average cost basis of holders. The market is in an "oversold" state, which has historically been viewed as a prime mid-to-long-term buying opportunity.
- Overvaluation Range (Sell Reference): When the MVRV Ratio > 3, it indicates that the market is sitting on massive unrealized profits, and the price may be significantly overvalued, often preceding a major correction.
Notably, a report from the research firm Messari pointed out that the duration Bitcoin spends with an MVRV Ratio above 3 has been shrinking as the market matures:
- 2011: Stayed above 3 for approximately 4 months.
- 2013: Stayed above 3 for approximately 10 weeks.
- 2017: Stayed above 3 for approximately 3 weeks.
- 2021: Stayed above 3 for only 3 days.
- 2022 to Present: The indicator has yet to break above the 3.0 threshold again.
The NUPL Indicator: A Tool for Identifying "Bottom-Fishing" Opportunities
NUPL (Net Unrealized Profit/Loss) is an indicator derived by subtracting RV from MV and then dividing by MV to normalize the data. Since market prices and holding costs are transparent on the blockchain, we can calculate the total floating profit or loss of all addresses on the network. To provide more precise comparisons across cycles, analysts often use a standardized version known as the MVRV Z-score.
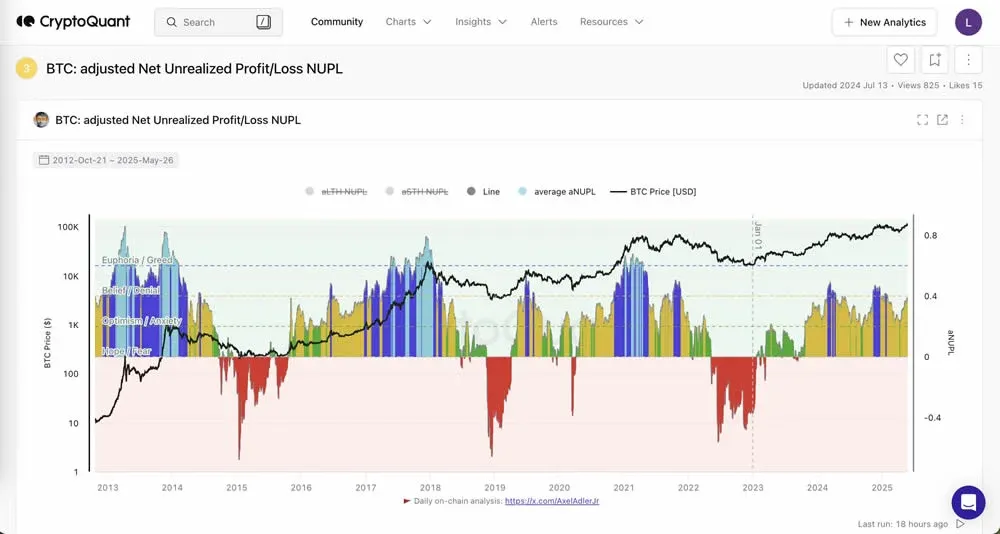
Looking at historical data, NUPL turning negative (the red areas in the chart) typically occurs roughly every four years. This state signifies that the majority of holders are in a loss position, and market sentiment is characterized by extreme pessimism or "capitulation."
- Bottom Signal: When NUPL dips into negative territory, it usually corresponds with a cyclical bottom for Bitcoin prices. For contrarian (left-side) traders, this represents a high-probability entry point. Although fear is at its peak during these times, the risk-to-reward ratio is often at its most favorable.
- Limitations: NUPL is relatively less sensitive when it comes to identifying the exact "top" of a market. Therefore, it is better suited as a tool for finding floor support. To determine exit timing at the peak, it is recommended to synthesize NUPL with other momentum and volume indicators.
Summary
MVRV and NUPL are sentiment indicators distilled from raw on-chain data, designed to help investors quantify whether the market is in a state of irrational exuberance or extreme fear.
- MVRV focuses on observing the "ratio between market value and cost."
- NUPL focuses on observing the "overall profit/loss status of the market."
The fundamental logic of both is similar: they reveal market patterns by comparing the "current price" with the "acquisition cost." With the massive influx of institutional capital in the current cycle—driven by instruments like Bitcoin Spot ETFs—the market structure has undergone significant changes. Whether these historical indicators will experience "drift" or shifts in their reference values remains to be seen. However, in the process of formulating an investment strategy, they remain essential coordinates for judging the broader market cycle.
Related Reading
- Bitcoin Identity Crisis: Dropping Safe‑Haven Appeal
- Bitcoin Returns to $90K, BlackRock ETF Investors Profit
- Bitcoin dips below $80,000, briefly under $76,000
💡 Register on Binance with referral code B2345 for the maximum trading fee discount. See Binance complete guide.



