
 Bitaigen Research
In this article we conduct an in‑depth analysis of Bitcoin’s recent consolidation phase, combining technical indicators with macro‑economic factors to assess the likelihood of a new high. By interpreting moving averages, momentum, and Bollinger Bands, we aim to help readers spot critical turning points and judge the market’s future direction. If you want to know whether Bitcoin is poised to break a significant barrier, keep reading.
Bitcoin Price Forecast
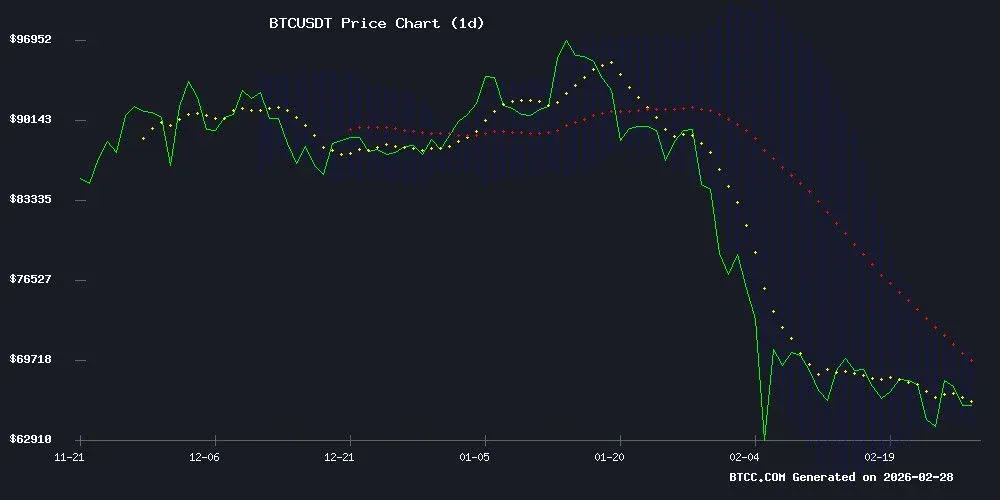
BTCUSDT Technical Analysis
During the current consolidation phase, if Bitcoin can break above the 20‑day moving average and hold the lower Bollinger Band while receiving macro‑level tailwinds—such as rising inflation, heightened geopolitical risk, and increased institutional demand—it could resume its upward thrust toward the pivotal $70,000 level and potentially kick off a new rally, meriting close attention.
At the time of writing, BTCUSDT is trading at 65,869.49 USDT, which is below the 20‑day moving average (67,305.39), indicating that short‑term selling pressure remains. The MACD histogram stands at ‑1,313.52, further confirming downward momentum. The lower Bollinger Band sits at 64,432.42, acting as recent support. As BTCC financial analyst Michael explains: “If price holds the lower Bollinger Band, a bounce toward the $67,000 USDT area is plausible; a move to $70,000 USDT, however, will require a decisive break of the moving average.”
Market Sentiment and Fundamental Catalysts
- Geopolitics: The closure of the Strait of Hormuz has disrupted oil shipments, increasing demand for hedging assets.
- Macro‑economics: A 5 % inflation rate often pushes investors toward inflation‑resistant stores of value, which is bullish for Bitcoin.
- Long‑term trend: The “adjustment” in 2026 is viewed as a sign of market maturity and declining leverage, suggesting a healthier long‑term trajectory.
Michael adds: “Volatility around the $65,000 mark, combined with rising mining difficulty, is reshaping miners’ economics. While this creates short‑term pressure, a favorable macro backdrop could lay a sturdier foundation for the next upward wave.”
Key Drivers Influencing Bitcoin’s Price
1. Strait of Hormuz Closure and 5 % Inflation
Iran’s blockade of the Strait of Hormuz has cut off roughly 20 % of global oil transport. JPMorgan analysts warn that crude could climb to $120‑130 per barrel, potentially pushing U.S. inflation toward 5 %. Against this backdrop, Bitcoin has been trading within a band near $67,000.
- If Bitcoin breaches the moving average at $67,627, traders may set the next target at $74,000.
- Escalation in the Middle East could test the $60,000 support level.
2. 2026 Pull‑back Signalling Market Maturity
- The first 50 days of 2026 saw a 23 % decline, but the depth of the drop differs from historic bear markets, being driven mainly by macro re‑pricing.
- Prices have retreated about 45 % from the peak, and annualised volatility has fallen to 40 %, indicating structural maturity.
- The trading range has narrowed to $60,000‑$70,000, suggesting consolidation rather than a collapse.
3. Rising Mining Difficulty and Miner Economics
- This week network difficulty rose 15 % to 144.4 trillion hashes, the largest quarterly adjustment since 2021.
- Higher difficulty forces miners to allocate more hash power to secure block rewards, tightening cash flow.
- Large‑scale operators with renewable‑energy contracts or ample reserves can weather the shock, whereas smaller miners may be forced to sell assets, adding further downside pressure.
Can Bitcoin Reach $70,000?
Weighing technical and fundamental factors:
- Immediate resistance: The 20‑day moving average (67,305 USDT) remains above price, acting as a negative factor.
- Momentum indicator: MACD is negative, reflecting downward thrust.
- Key support: The lower Bollinger Band (64,432 USDT) offers a potential recovery base.
- Macro sentiment: News flow is neutral‑to‑positive; inflation and geopolitical tension could act as catalysts.
Michael concludes that the market is currently in a consolidation phase. Only if Bitcoin re‑establishes itself above the 20‑day moving average and receives supportive macro news could it break $70,000 USDT. While trading below the average, risk management remains paramount. The most probable short‑term scenario is a horizontal range between the lower Bollinger Band and the moving average, after which a decisive directional move may emerge.
---
This concludes the full analysis titled “Bitcoin price forecast: Can Bitcoin break $70,000 during market consolidation?” For additional Bitcoin price predictions, search for past articles by Bitaigen (比特根) or continue browsing the related content below. Thank you for your support!
Related Reading
- Tesla & SpaceX Bitcoin Play: Musk Calls It Digital Gold
- Michael Saylor Urges Buying Bitcoin, Price Falls Below $125K
- 2026年比特币价格预测:守住7.4万美元还是跌至3.8万美元?
💡 Register on Binance with referral code B2345 for the maximum trading fee discount. See Binance complete guide.



