
 Bitaigen Research
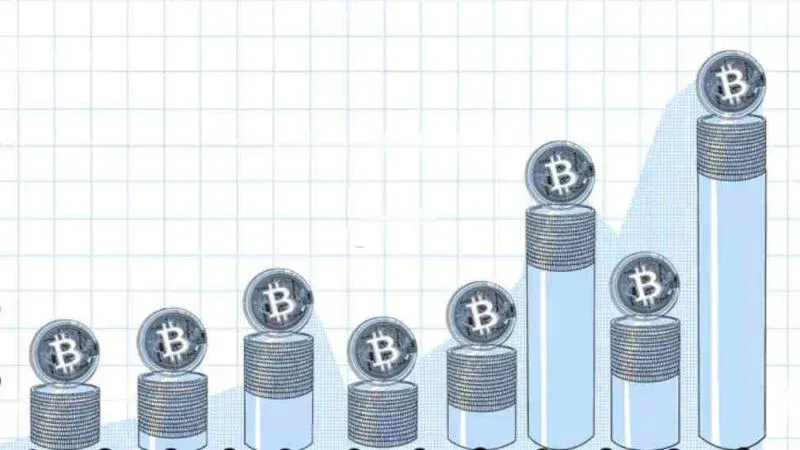
 When reviewing the overall evolution of Bitcoin, the first thing to grasp is how its price trajectory has risen and fallen over time. Since its debut in 2009 at a starting point of $0.0025, this decentralized digital asset has undergone multiple pronounced swings, ultimately breaking the $120,000 historical high in 2025 and becoming a significant topic on the global financial map. Below we start with a macro‑level view of the price path, then drill down into influencing factors, key historical milestones, and future outlook.
In this article we systematically map Bitcoin’s price journey from its birth to the recent breakthrough, focusing on the driving forces behind each pivotal market move and projecting possible future trends. By combining macro and technical perspectives, we aim to help readers discern historical patterns, spot potential opportunities, and warrant a careful read.
Bitcoin Price History: Key Trends of Recent Years
Early Growth and Low Awareness (2009‑2016)
When Bitcoin first emerged, the market was tiny and public awareness was virtually non‑existent. Trading activity was limited to early developers and a handful of enthusiasts, and the price showed a slow but relatively steady rise. The concepts of decentralization and scarcity were laid down during this stage, forming the basis for long‑term appeal.
First Major Bull Market (2017)
After entering 2017, Bitcoin’s price surged explosively, capturing the attention of retail investors worldwide, and speculative trading became mainstream. By the end of the year the price approached $20,000, followed by a sharp correction that marked a complete bull‑to‑bear cycle.
Market Adjustment and Consolidation (2018‑2019)
Following the 2017 peak, Bitcoin entered a two‑year bear market with a substantial price decline. Although sentiment was subdued, developers continued to push technical upgrades, and long‑term holders took the opportunity to accumulate at lower costs.
Institutional Adoption and New Highs (2020‑2021)
The 2020 halving sharply reduced new coin issuance, after which institutional capital flowed in at scale. Companies such as MicroStrategy added Bitcoin to their balance sheets, pushing the price to a seasonal high of around $69,000 in November 2021 and further cementing its store‑of‑value narrative.
Macro Pressures and Market Reset (2022‑2023)
Rising global interest rates and resurging inflation hit risk assets, and Bitcoin experienced a noticeable pullback. Several crypto firms collapsed, briefly denting investor confidence, yet the network remained operational without systemic interruption.
Recovery, Regulatory Clarity, and Maturation (2024‑2025)
With the approval of a U.S. spot ETF and expectations of crypto‑friendly policies, Bitcoin first breached $100,000 at the end of 2024 and climbed to $120,000 in 2025, setting a new all‑time high. This phase signals a more mature market, with significantly higher participation from traditional financial channels.
What Factors Influence Bitcoin’s Price?
Bitcoin’s value, like most assets, is shaped by the interaction of supply‑demand dynamics, market perception, and external environment. Specifically, the following factors are most critical:
- Extreme Scarcity and the 21‑million Cap
The protocol fixes the total supply at 21 million bitcoins, making the supply immutable. When demand keeps rising while supply approaches its limit, every circulating bitcoin commands a higher scarcity premium.
- Halving Mechanism’s Periodic Boost
Every 210,000 blocks (approximately four years) the block reward is cut in half. The most recent halving occurred on April 19 2024, further tightening daily issuance. Historically, halvings tend to fuel subsequent bull markets because, with relatively stable demand, the abrupt supply contraction adds upward pressure on price.
- Popularity and Perceived Value
Unlike fiat, Bitcoin’s price heavily depends on global consensus and “perceived value.” Institutional allocations, real‑world payment use cases, and public recognition of Bitcoin as a hedge asset generate positive demand pressure; conversely, waning sentiment or a broken consensus can trigger rapid price declines.

Which Year Did Bitcoin Experience a Massive Surge?
Historical data shows Bitcoin’s first dramatic surge occurred in 2013. The price climbed from roughly $13 at the start of the year to over $1,100, an increase of more than 80×, marking Bitcoin’s debut in the public eye. Subsequent notable rallies aligned with halving cycles include:
- 2017: From below $1,000 to near $20,000, a roughly 20× annual gain.
- 2020‑2021: Driven by accommodative monetary policy and institutional inflows, the price peaked at about $69,000 in November 2021.
- 2024‑2025: Influenced by the U.S. spot ETF approval and policy expectations, the price broke $100,000 at the end of 2024 and surged to $120,000 in 2025, setting a new record.
How Much Could Bitcoin Rise in the Future?
Bitcoin’s price volatility is extreme; short‑term swings of several thousand dollars per day are common. During the high‑volatility period of 2026, daily moves often range between $5,000‑$10,000. For investors lacking a clear strategy, such “jump‑the‑gap” fluctuations can provoke emotional stress and capital loss; long‑term holders may view them as normal growing‑pains of an maturing asset.
Analysts generally point to continued institutional inflows (e.g., net inflows into spot ETFs), the post‑halving supply gap, and technical upgrades such as the Lightning Network as foundational momentum for another price breakout. Currently, BTC appears to be building up for a technical breakout.
Nevertheless, a reversal in market sentiment can be triggered by a single catalyst. Stringent regulation, tightening macro‑liquidity, or competition from emerging layer‑1 chains could curb price appreciation near current highs. Consequently, investors should consider dynamic profit‑taking and hedging tools to navigate the rapidly shifting external environment.
*Note: Cryptocurrency gains may be taxable in your jurisdiction; consult a tax professional for guidance.*
Bitcoin Price Forecasts 2026‑2040
2026 Forecast: $75,000‑$95,000
BTCC analyst Michael projects Bitcoin to trade within this band in 2026, driven primarily by expectations of a Federal Reserve rate cut (95.7 % probability), continued spot‑ETF inflows, and the upcoming halving effect.
2030 Forecast: $120,000‑$180,000
With higher institutional adoption and an improving global liquidity backdrop, Bitcoin is expected to break the $120,000 threshold by 2030, enhancing its hedge‑like characteristics.
2035 Forecast: $250,000‑$400,000
By then, Bitcoin’s role as “digital gold” should be more firmly entrenched. Salvadoran President Nayib Bukele has disclosed that the country’s Bitcoin holdings have generated a 560 % return, illustrating the potential value of long‑term possession.
2040 Forecast: $500,000‑$1,000,000+
In an extreme scenario where Bitcoin becomes part of global reserve assets, the price could surpass the $1 million mark. Such projections remain sensitive to regulatory developments, technological progress, and other macro uncertainties.
In summary, answering “Which year did Bitcoin experience a massive surge?” and “How much could it rise?” hinges on understanding its scarcity, halving cadence, and deepening institutional consensus. While Bitcoin possesses considerable growth potential, its high volatility remains a non‑negligible risk factor. Investors should balance the prospect of substantial upside against the possibility of sharp drawdowns to maintain resilience in this long‑term compounding game.
The above provides an overview of Bitcoin’s development trajectory and outlook. For further updates, follow Bitaigen (比特根).

Localisation notes:
- All fiat references are expressed in USD.
- For cross‑border fiat transfers, SEPA (for EUR) and SWIFT are the standard channels.
- U.S. residents wishing to trade Bitcoin on a regulated exchange should use Binance.US rather than the global Binance platform.
Related Reading
- How Declining Inflation Shapes Bitcoin Narrative and Price Trends
- Bitcoin Approaches $70K as Fed Rate‑Cut Hopes Fade
- Bitcoin Breaks $84,000 Support: Can BTC Drop to $50,000?
💡 Register on Binance with referral code B2345 for the maximum trading fee discount. See Binance complete guide.



