

We examine Bitcoin’s recent rally from the perspectives of chart patterns, moving‑average support, and RSI momentum, and we combine the market effect of short‑sellers being forced to cover. This comprehensive analysis aims to help readers identify critical levels and make a rational assessment of whether further upside is feasible. The full text is worth a careful read.
Technical analysis of recent Bitcoin rally
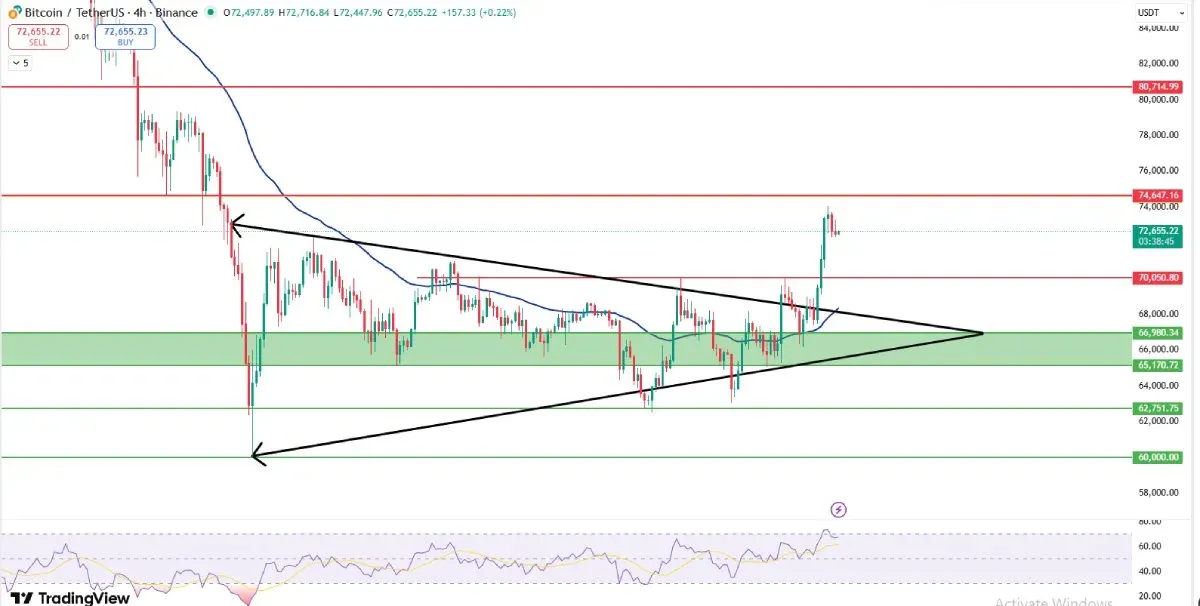
In the past few weeks, BTC has formed a symmetrical triangle consolidation near the $70,000 level. The upper trendline of this triangle repeatedly halted upward price moves until the most recent breakout.
When price successfully pierced the triangle and settled above $70,000, the 50‑day moving average, which had acted as resistance, flipped to act as support, further solidifying the short‑term bullish structure. The current RSI sits around 66, indicating that momentum remains on the stronger side; although there has been a modest pull‑back, the overall trajectory stays upward.
If Bitcoin can hold above $70,000, the next key resistance lies around $74,600. Should that level convert into support, the subsequent target could extend toward $80,000. Conversely, a break below $70,000 may push the market into a waiting phase, requiring more time before another upward move can be re‑initiated.
Short‑seller liquidations fueling the price rise
The crypto market has recently experienced a wave of large‑scale short‑position liquidations. According to data released by Crypto Rover on X, roughly $424 million worth of short positions were forcibly closed within the past 12 hours.
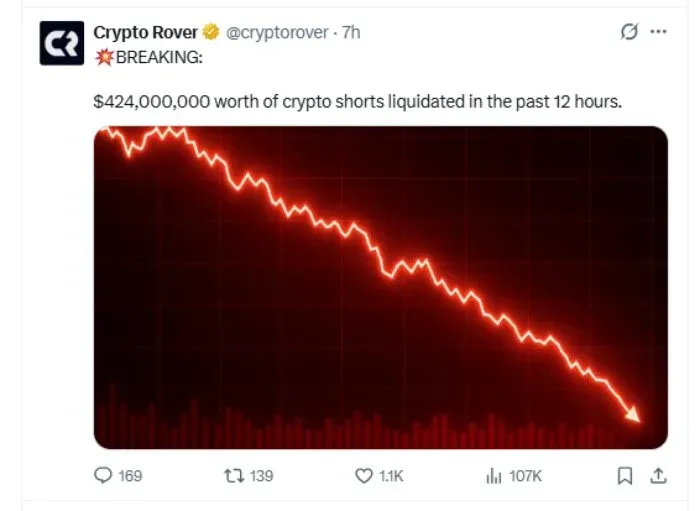
When short sellers are automatically liquidated during an unexpected price rebound, significant buying pressure is generated. This forced buying injected strong upward momentum into Bitcoin over a short period and became a major driver of the current rally.
Institutional inflows behind the move
Institutional activity is also providing support for Bitcoin. On‑chain analytics platform Onchain Lens shared on X that BlackRock withdrew approximately $345.23 million worth of 4,716 BTC and about $50 million worth of 33,231 ETH from Coinbase over the last 13 hours, while simultaneously depositing roughly $25.04 million worth of 12,084 ETH elsewhere.
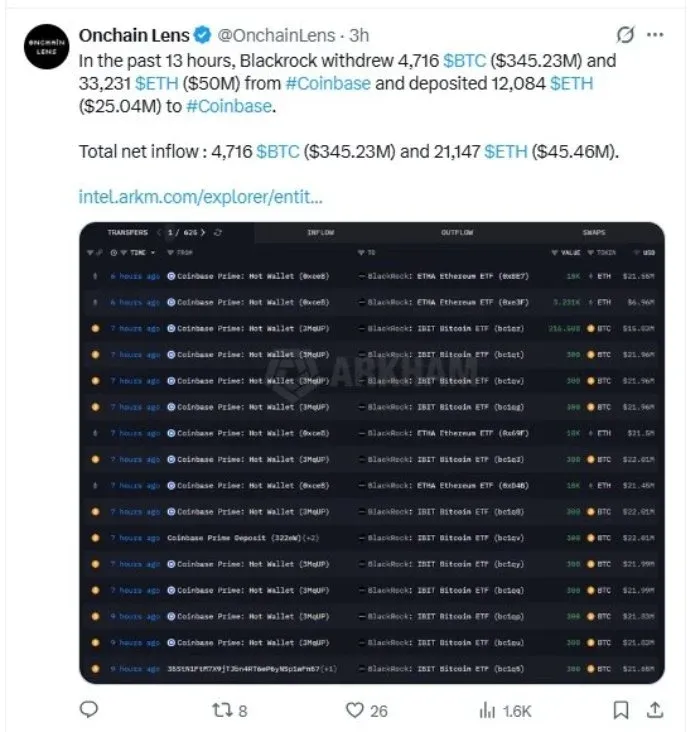
In total, the net inflow amounts to about 4,716 BTC and 21,147 ETH, indicating that institutions are maintaining or even strengthening their interest in the two leading digital assets amid the current market environment. Such sizable capital movements are commonly interpreted as a sign of growing institutional confidence in the crypto sector.
Large‑leveraged longs as a market signal
Vivek Sen recently disclosed on X a noteworthy long position: a trader employed 20× leverage, committing roughly $46 million and holding about 650 BTC. The entry price was near $68,178, and as Bitcoin has risen above $72,000, the position is now firmly in profit territory.
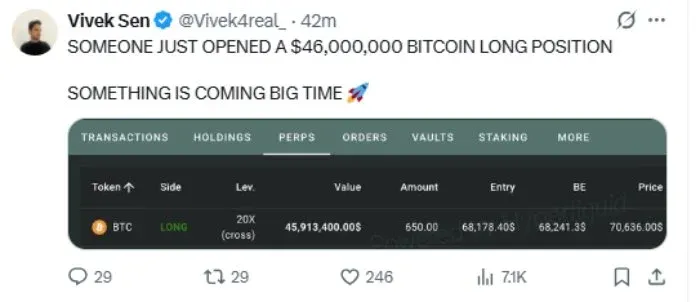
High‑leverage long positions often reflect strong optimism about the near‑term outlook, but they can also amplify price volatility around key resistance levels, as market participants closely monitor the performance of such sizable bets.
Shifts in market sentiment and Bitcoin’s safe‑haven narrative
When panic spreads through traditional financial markets, some institutional capital begins to flow toward digital assets, treating Bitcoin as “digital gold.” The total crypto market capitalization has risen back to approximately $2.44 trillion, up about 5.78 % over the past 24 hours. Bitcoin itself has breached the $73,000 threshold, setting a new recent high.
These shifts in capital allocation are reshaping sentiment within the crypto space, and traders are watching closely to see how long the renewed momentum can be sustained.
Higher‑timeframe breakout signals
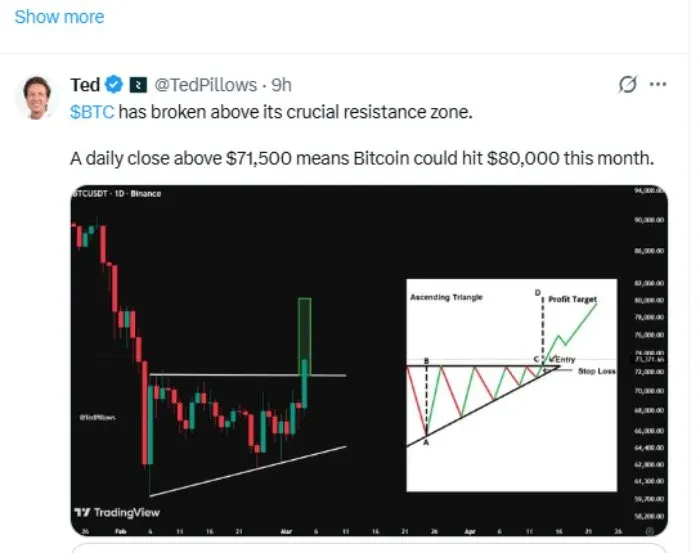
On longer‑term charts, price has already cleared a significant resistance zone. Analysis shared by Ted Pillows on X points out that as long as Bitcoin’s closing price remains above $71,500, a short‑term trajectory toward the $80,000 target appears plausible. Such breakouts are typically read as a sign that buyers are in control, further bolstering bullish sentiment.
Conclusion: Can Bitcoin reach $80,000 this month?
Taking into account the technical picture, short‑seller liquidations, institutional inflows, and sizable leveraged long positions, Bitcoin is currently trading above the critical $70,000 support level. If it can cleanly break through the $74,600 resistance zone, the $80,000 target becomes attainable. Conversely, a drop below $70,000 could stall upward momentum, requiring a longer period for the rally to resume.
For more in‑depth analysis of Bitcoin price forecasts, continue following Bitaigen’s (比特根) upcoming reports.
Related Reading
- Bitcoin $1 Million Forecast: Key Conditions Required
- Bitcoin $70K: Sideways Consolidation, OI Rise & Breakout
- Bitcoin Price Forecast 2026‑2040: Long-Term Outlook
💡 Register on Binance with referral code B2345 for the maximum trading fee discount. See Binance complete guide.


