
In this article we outline Bitcoin’s price trajectory over the past fifteen years, deeply analyze the structural shifts behind its market‑capitalisation breakthrough—from its macro‑hedge attributes to regulatory frameworks and the opening of compliant channels. Using charts and case studies, we aim to help readers identify the key inflection points in Bitcoin’s value evolution and glean insights into future trends.
3. Structural Shifts Behind Historical New Highs
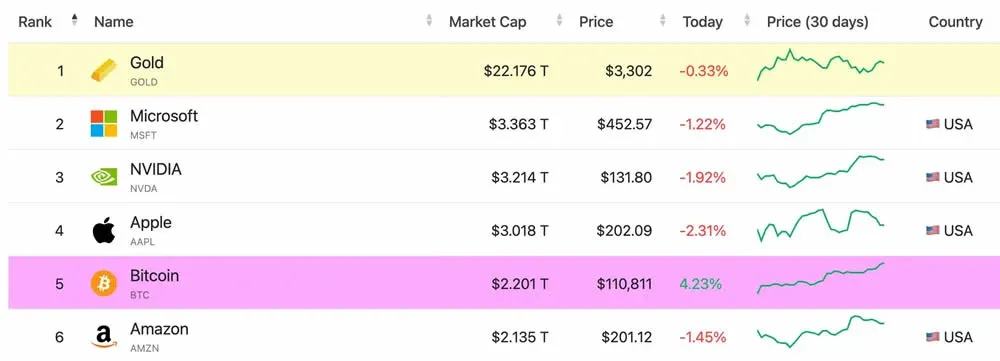
Bitcoin’s market capitalisation has surpassed USD 2.1 trillion, overtaking Amazon and ranking among the world’s five largest asset classes. Its value‑support framework has undergone fundamental changes:
1️⃣ The attribute of a macro‑hedge tool has become increasingly prominent;
2️⃣ Regulatory rules in the United States, Europe and other regions have been enacted one after another;
3️⃣ compliant channels such as Coinbase, BlackRock, and other institutional platforms have opened the door for traditional capital.
Laszlo’s 10,000‑BTC‑for‑pizza transaction was once mocked as “stupid”, but from today’s perspective it exemplifies the Austrian‑school “subjective theory of value”: value originates from collective consensus, not from the physical asset itself. Over fourteen years, Bitcoin has evolved from experimental code on geek‑focused forums into a “free currency” believed by hundreds of millions, and its price curve mirrors humanity’s growing understanding of decentralized finance.
2. Bitcoin Price Curve Over the Past 15 Years
Comparing the USD 0.0041 starting point with today’s USD 110,000 peak, and using the closing price on May 22 each year provided by bitsCrunch.com, the key stages and driving forces of Bitcoin become clearly visible.
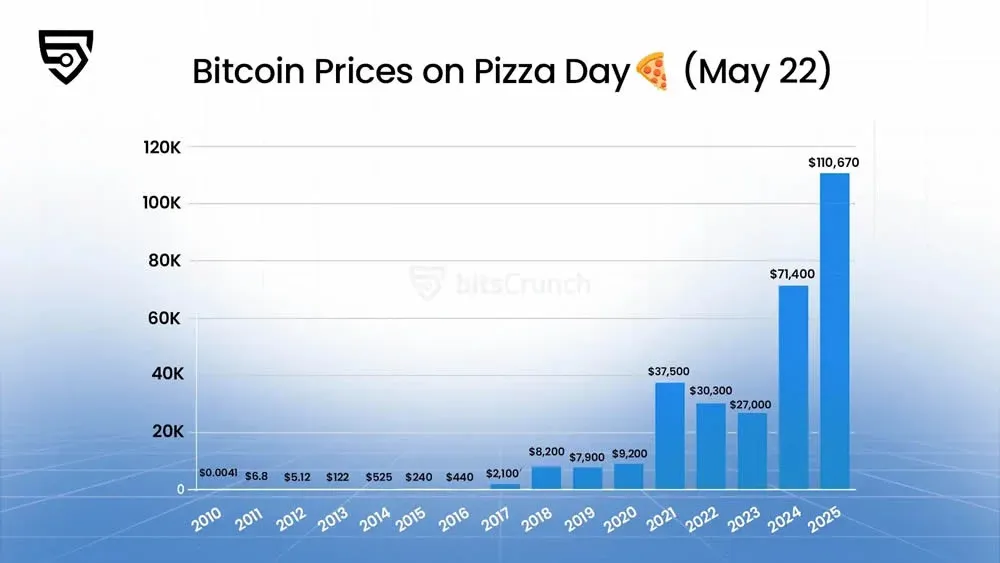
Data source: bitsCrunch.com
- Technical Maturation Phase (2010‑2013)
- In May 2011 Bitcoin rose to USD 6.8, and the dark‑web “Silk Road” first showcased its anonymous‑payment capability;
- In May 2013 the price broke USD 122; the Cyprus debt crisis led many to view Bitcoin as a “safe‑haven asset”, producing an annual gain of 5,400 %.
- Speculative Frenzy Phase (2014‑2017)
- In 2014 Mt.Gox was hacked; the price fell from USD 525 to USD 240 (by 2015), giving the market its first large‑scale risk‑education episode;
- Subsequent breakthroughs such as Ethereum smart contracts and the Lightning Network expanded the ecosystem, pushing Bitcoin back to USD 2,100 in May 2017 and, fueled by the ICO boom, to USD 19,783 in December 2017, completing the first “super‑cycle”.
- Institutional Awareness Phase (2018‑2021)
- The 2018 bear market drove many retail participants out, while institutional players like the Grayscale Trust and MicroStrategy entered, laying the groundwork for later buying pressure;
- In May 2021 the price touched USD 37,500 as companies such as Tesla and countries like El Salvador added Bitcoin to their balance sheets. The approval of a U.S. spot Bitcoin ETF in 2024, the fourth halving, and global fiat‑currency inflation collectively propelled the price beyond USD 71,400, delivering an annualised return of 217 %. (U.S. residents should use Binance.US rather than the global Binance platform for comparable services.)
The chart below shows the monthly trajectory for each May from 2017 to 2024.

Data source: bitsCrunch.com
- Mainstream Acceptance Phase (2022‑2025)
With central bank digital currencies gaining momentum, the Web 3 ecosystem maturing, and blockchain technology being deeply integrated across industries, digital assets are reshaping the economic landscape. Bitcoin, as a pioneer of this transformation, now derives value not only from its price but also from the ethos of decentralisation and technological innovation it embodies. For fiat transactions, USD remains the primary medium, while cross‑border transfers typically rely on SEPA (for euros) or the SWIFT network.
1. The Starting Point of a Value Awakening
In 2010 the Bitcoin network was still in its “primitive society” stage: total network hashpower was less than one‑ten‑thousandth of today’s level, exchanges did not exist, and holders were mostly geeks and tech enthusiasts. When Laszlo posted the idea of “using Bitcoin to buy pizza” on a forum, the coin’s value anchor was essentially a blank slate.
On May 22, 2010, American programmer Laszlo Hanyecz purchased two Papa John’s pizzas for 10,000 BTC, marking the first real‑world payment with Bitcoin. At that moment the 10,000 BTC were worth roughly USD 41, or USD 0.0041 per coin.
If Bitcoin were to reach USD 100,000, those two pizzas would be valued at nearly USD 1 billion. This figure not only represents a milestone in Bitcoin’s early development but also highlights the leap from a fringe experiment to a globally recognised asset class.
4. Conclusion: Consensus Creates Value
Every year the #PizzaDay hashtag trends on social media, with users sharing pizza photos while reflecting on Bitcoin’s evolution and the outlook for digital assets. The pizza‑day celebration has transcended a simple commemoration; it now serves as a symbol of community cohesion, reminding us that technological innovation and institutional reform often spring from the smallest practical acts.
Just as Satoshi Nakamoto embedded the The Times headline “*British Chancellor Prevents Second Bailout*” in the genesis block, Bitcoin’s ultimate mission may be to bring the freedom ethos behind those two early pizzas into reality. Each of us is a participant in this history, and we will continue to witness and help drive the evolution of digital currency.
*Note: Cryptocurrency gains may be taxable under the laws of your local jurisdiction.*
Related Reading
- Shiba Inu (SHIB) Token Supply, Liquidity & Price Analysis – 2024 Guide
- How to Buy Bitcoin Cheaply: Instant Buy vs Peer‑to‑Peer (C2C) Fee Comparison
- Bitcoin Market Cap Hits $1.15 Trillion as Price Surges to $62,207
💡 Register on Binance with referral code B2345 for the maximum trading fee discount. See Binance complete guide.


