
 Bitaigen Research
 In this article we conduct an in‑depth analysis of why Bitcoin has recently struggled to break through a critical resistance level. By combining on‑chain position structures, spot‑fund flow dynamics, and derivatives‑market activity across multiple dimensions, we aim to help readers identify the real drivers behind the price’s stagnation. If you want to know which forces are quietly constraining the market, keep reading.
Summary
Bitcoin’s failure to breach the $100,000 mark is primarily due to upward‑locked supply, short‑term selling pressure, and low‑leverage participation in derivatives, together with weakening spot‑fund inflows and insufficient market‑maker Gamma positions. These factors collectively impede sustained upward movement.
- On‑chain structure remains fragile: Although Bitcoin’s price has shown a modest recovery, large‑holder positions that have been held for the long term are still on the sidelines, providing limited support.
- Supply backlog persists: When price climbs, holders who are locked in at high levels tend to sell, creating additional sell pressure that can suppress the rally at any moment.
- Spot‑fund flow turning warmer: Spot‑market data shows a resurgence of buying pressure, yet overall sentiment stays cautious.
- Corporate treasury activity is sporadic: Institutional purchases appear fragmented and event‑driven, lacking coordinated demand.
- Derivatives participation is sluggish: Both open interest and trading volume for futures contracts have declined, and leverage usage is constrained, resulting in lower market activity.
- Options market only pricing front‑end risk: Short‑term implied volatility (IV) has fluctuated, while medium‑ and long‑term volatility remains largely anchored.
- Hedging demand experienced a brief spike: A rapid surge in put‑option buying quickly receded, indicating the market has not entered a sustained bearish outlook.
- Market‑maker Gamma exposure is low: Market‑makers hold insufficient positions to provide an effective buffer, so modest order flow can trigger pronounced price swings.

On‑Chain Insights
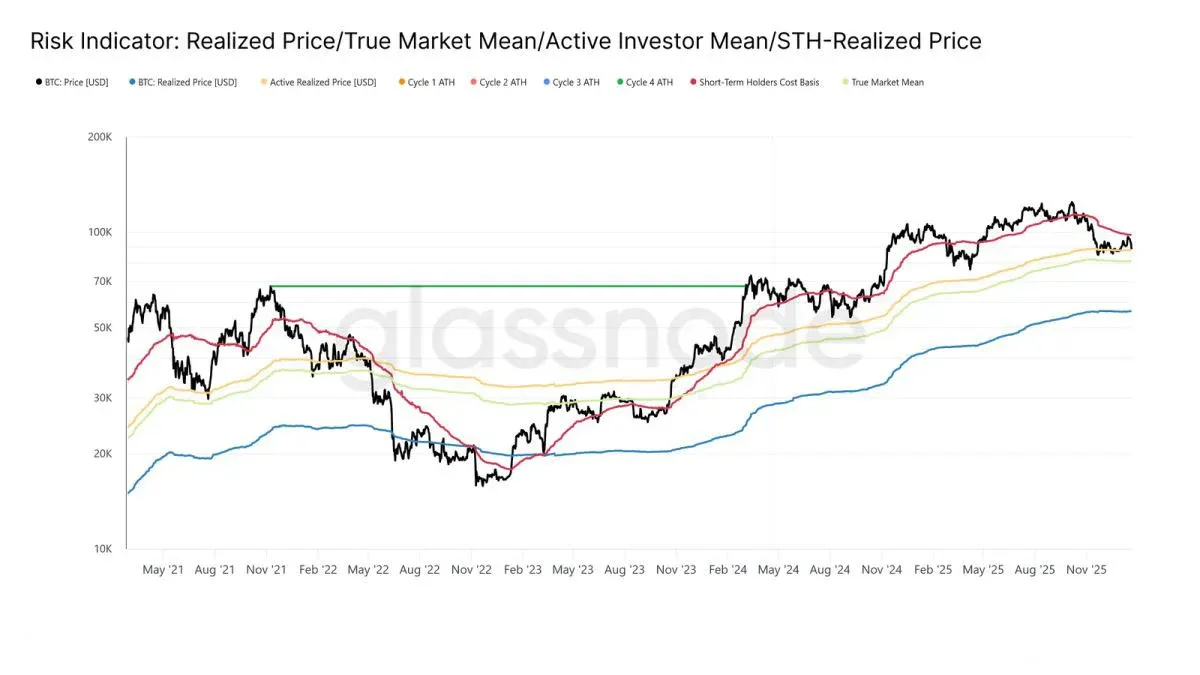
During the past two weeks the anticipated “oversold rebound” largely materialized. After advancing toward the resistance zone, price stalled below the cost basis of short‑term holders, reaffirming the presence of significant supply pressure above. In this context, the current report dissects the structure and behavior of this supply backlog, with a focus on emerging seller dynamics.
Rebound Meets Resistance
Reviewing recent on‑chain weekly reports yields a coherent narrative:
- The market has been operating in a moderately bearish corridor, with a floor price around $81,100 (average cost) and a ceiling corresponding to the recent entrants’ cost basis.
- In early January 2026, selling pressure temporarily faded, allowing price to rebound to the upper edge of the range.
- As price approached $98,000, locked‑in holders became active, seeking to unwind positions, which caused the rally to stall again.
- The recent blockage near $98,400 mirrors the early‑2022 pattern, suggesting that the recovery remains fragile.
Heavy Up‑Side Sell Pressure
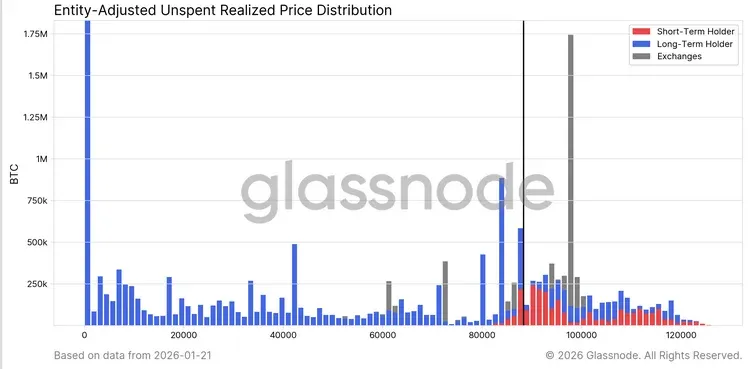
The URPD (Uptick‑Relevant Position Distribution) chart shows that the bulk of accumulated coins above $98,000 is the core obstacle to the rebound:
- The recent bounce filled the gap between $93,000 – $98,000, creating a new layer of accumulated positions.
- Above $100,000, a large stock of older coins remains, representing potential sell orders from long‑term holders.
- Without sufficient buying strength, these stacked positions will continue to suppress the two critical thresholds of $98,400 and $100,000.
Facing Mature Sellers
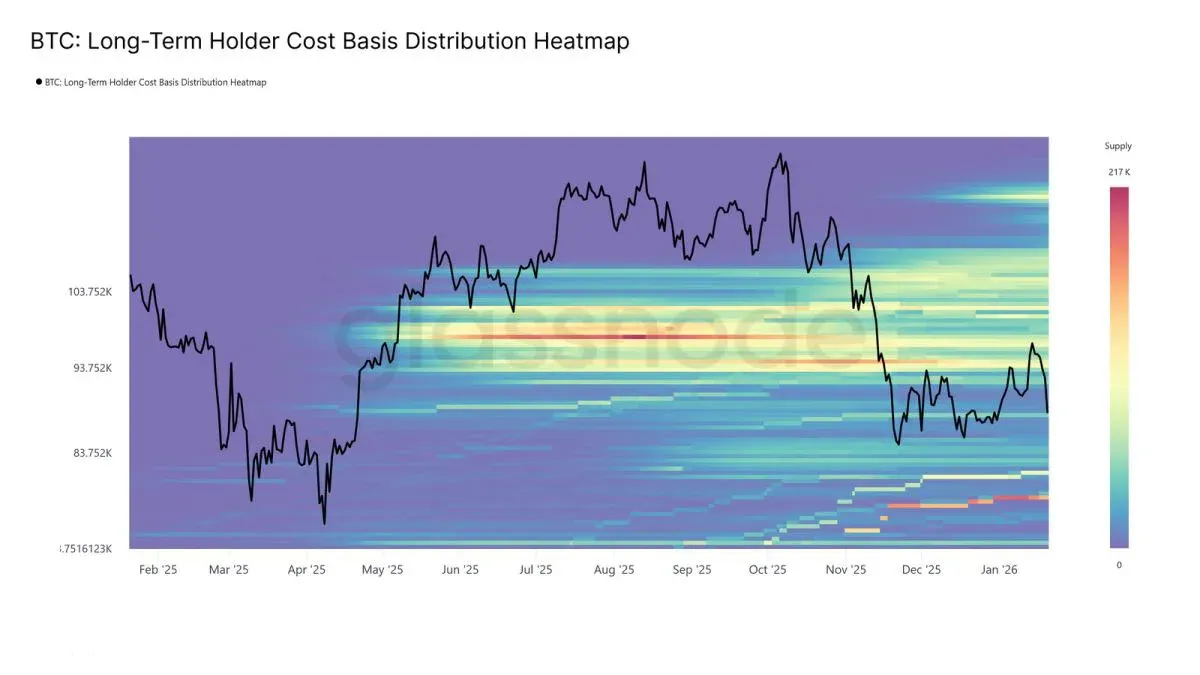
A cost‑basis heatmap for long‑term holders reveals:
- A substantial concentration of Bitcoin owned by long‑term investors sits just above the current price, forming a latent pool of sell orders.
- When price drifts back toward these holders’ entry levels, the probability of selling spikes dramatically.
- Unless new buyers emerge with enough vigor, these long‑term holders will act as a roadblock to further upside.
Distributing Relief to the Crowd
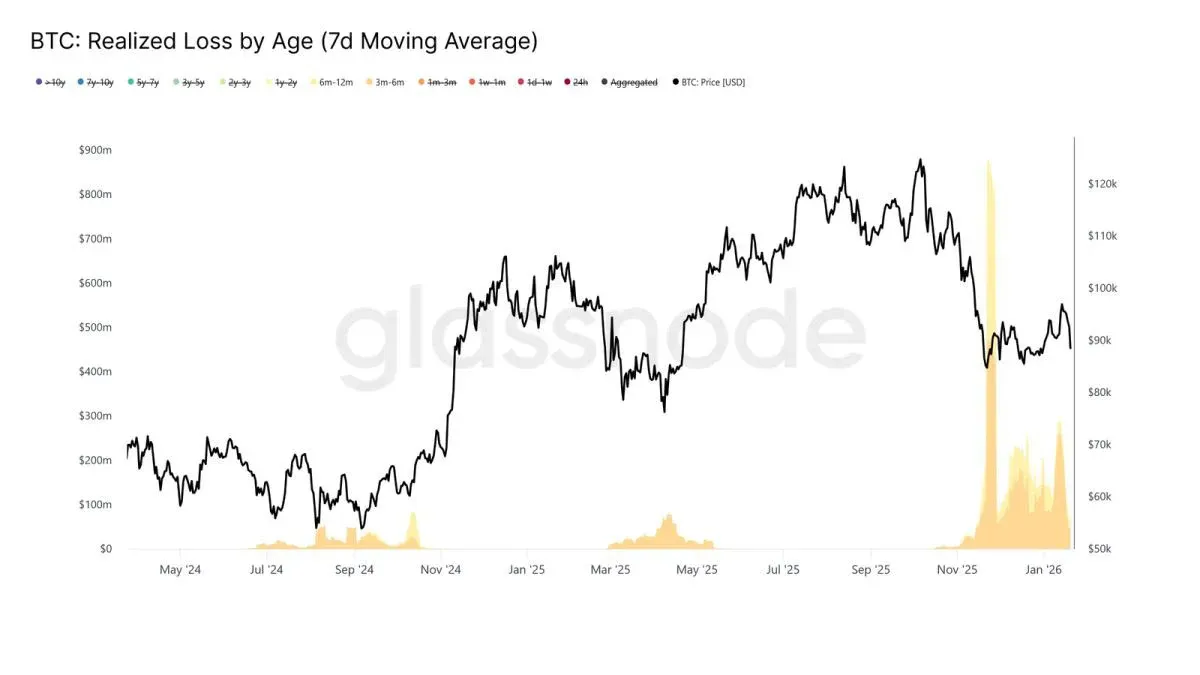
From the supply‑side perspective, the realized‑loss metric broken down by holding period shows:
| Holding Period | Contributed Realized Loss |
|---|---|
| 3‑6 months | Largest |
| 6‑12 months | Second largest |
- This indicates that top‑tier buyers (positions valued above $110,000) tend to unwind when price retreats to their entry range.
- Loss‑driven exits intensify sell pressure around the key recovery threshold.
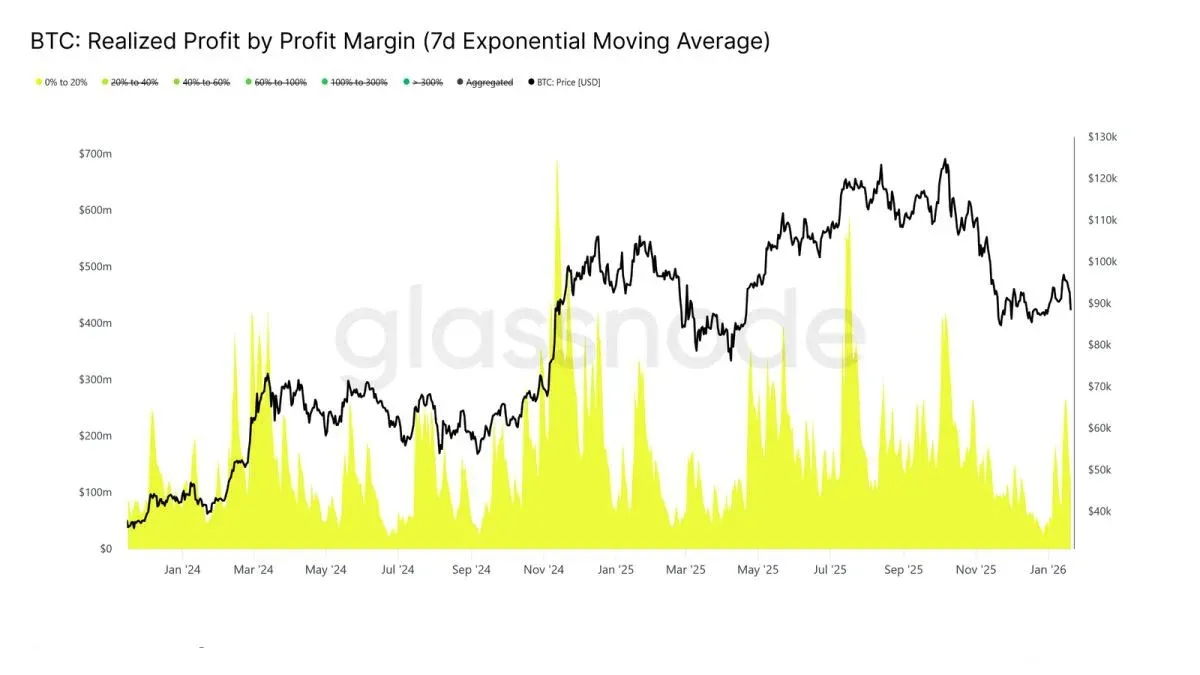
On the profit‑realization side, traders operating in the 0 %‑20 % profit range have contributed noticeably more, suggesting that breakeven sellers and short‑term swing traders are closing positions after modest gains, further dampening upward momentum.
Off‑Chain Insights
Spot‑Fund Flow Turning Warmer
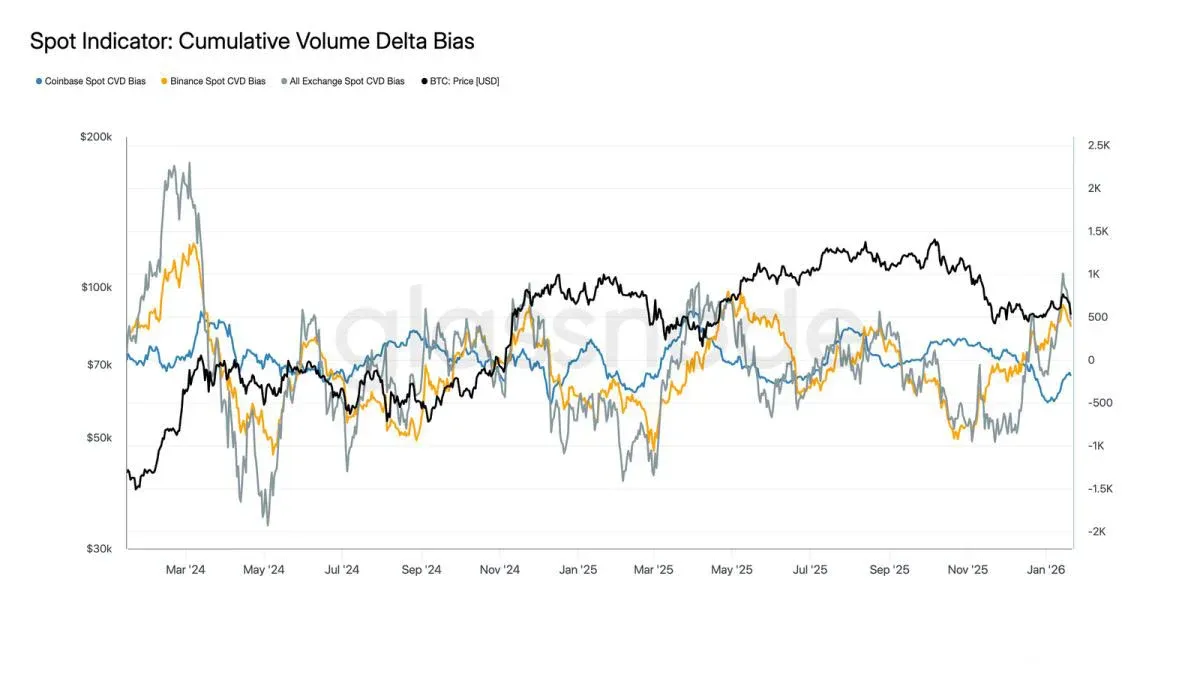
- Data from major exchanges (e.g., Binance, Coinbase) shows net buying re‑asserting dominance, while sell pressure eases.
- Coinbase’s net sell volume has dropped markedly, indicating a reduction in upward‑locked supply and providing modest support for price.
- Although buying intensity has not yet reached the “bull‑run frenzy” level, the spot‑market bottom has noticeably improved.
Note for U.S. traders: Access to Binance’s global platform is restricted in the United States; you should use Binance.US or another compliant venue for fiat on‑ramps (e.g., SEPA/SWIFT for EUR/USD transfers).
Corporate Purchases: Scattered
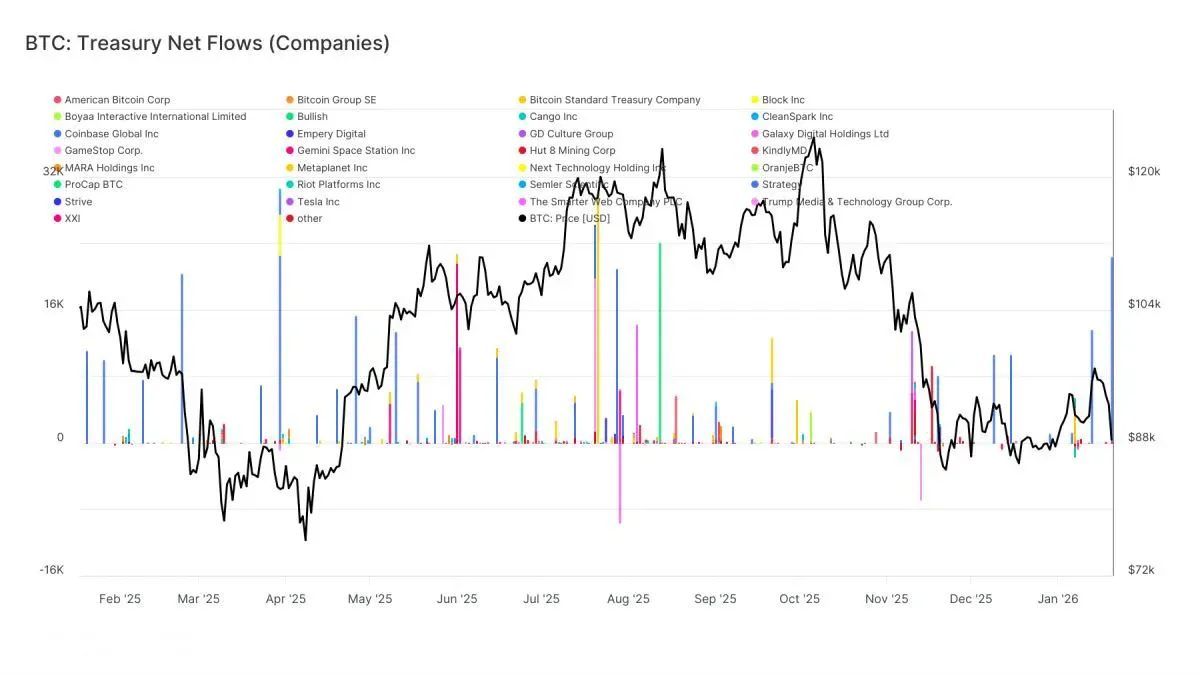
- Corporate treasury flows appear as isolated points rather than a coordinated accumulation effort.
- Funds generally oscillate in a “watch‑and‑occasionally‑buy” mode, lacking a sustained buying trend.
- This contrasts sharply with the earlier period when multiple companies entered the market simultaneously, fuelling sharp price spikes; today, corporate demand plays only a peripheral role.
A Quiet Futures Market
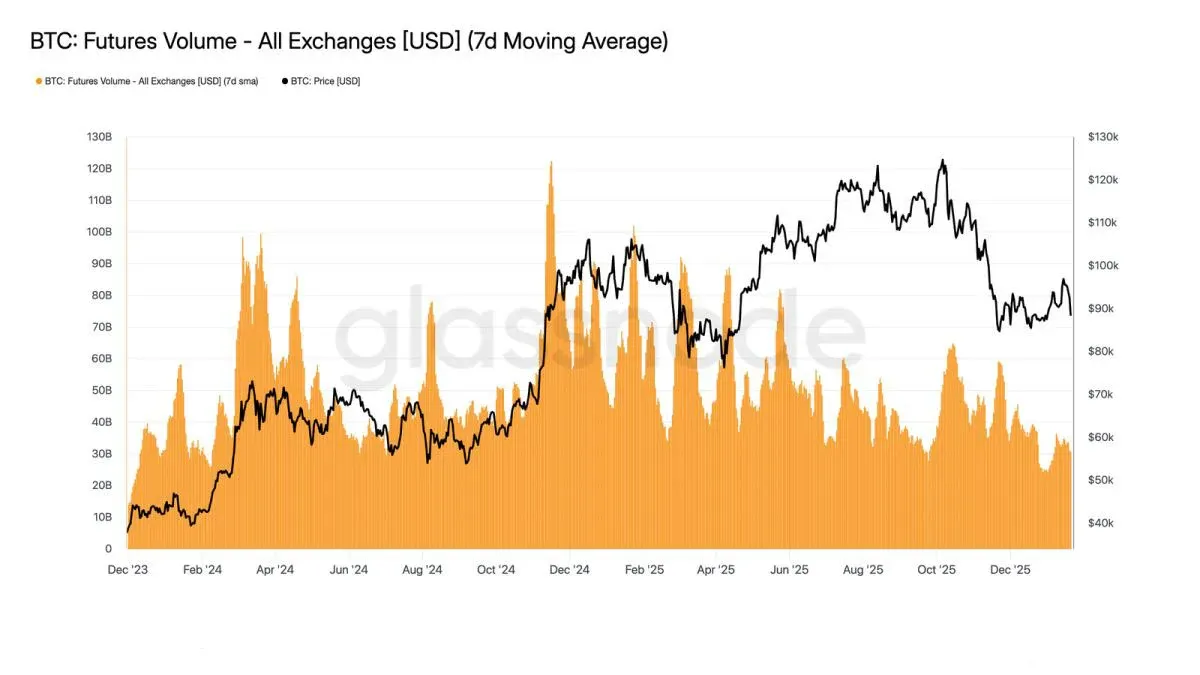
- Bitcoin futures trading volume continues to contract, with activity far below the levels seen in a healthy market.
- Price swings are mainly driven by thin liquidity rather than large‑scale leveraged position building.
- Open interest shows some fluctuation, but volume does not rise in tandem, suggesting that capital is mostly rotating internally and that fresh leveraged inflows are scarce.
Concern Focused on Immediate Risks
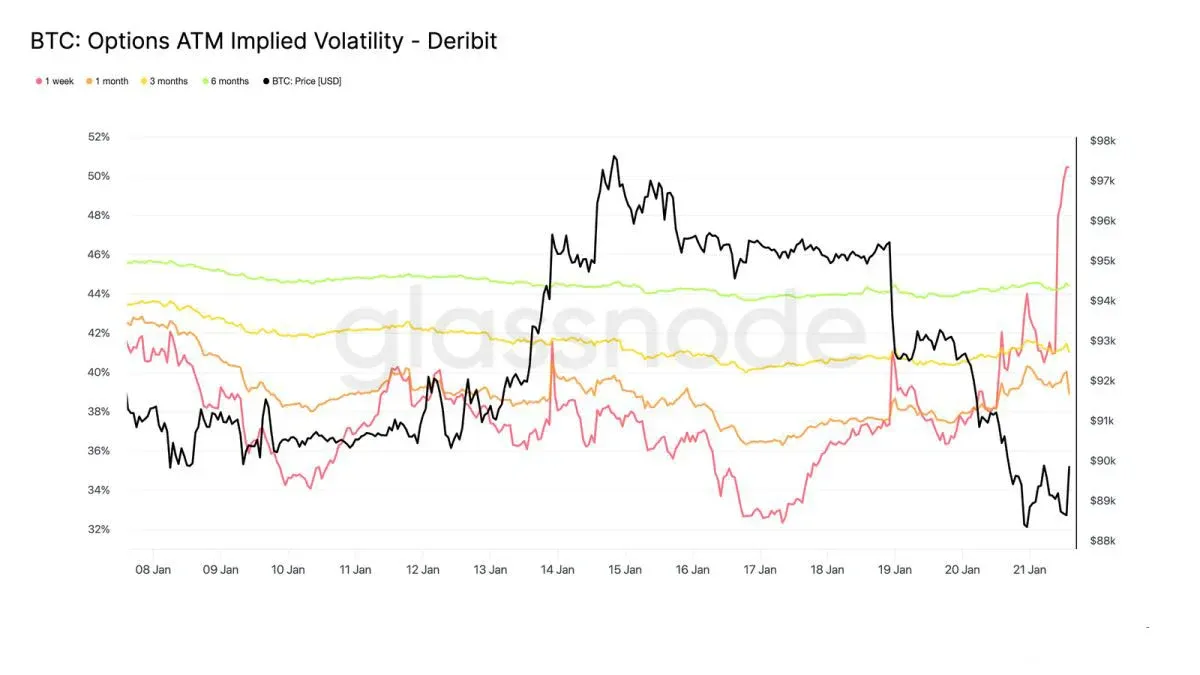
- Short‑term volatility (VIX‑style metric) surged significantly within a week, while three‑month and six‑month volatility metrics changed only marginally.
- This pattern indicates that traders are boosting short‑term hedging against sudden events, yet they maintain relatively stable expectations for medium‑term risk.
Short‑Term Sentiment Swings Dramatically
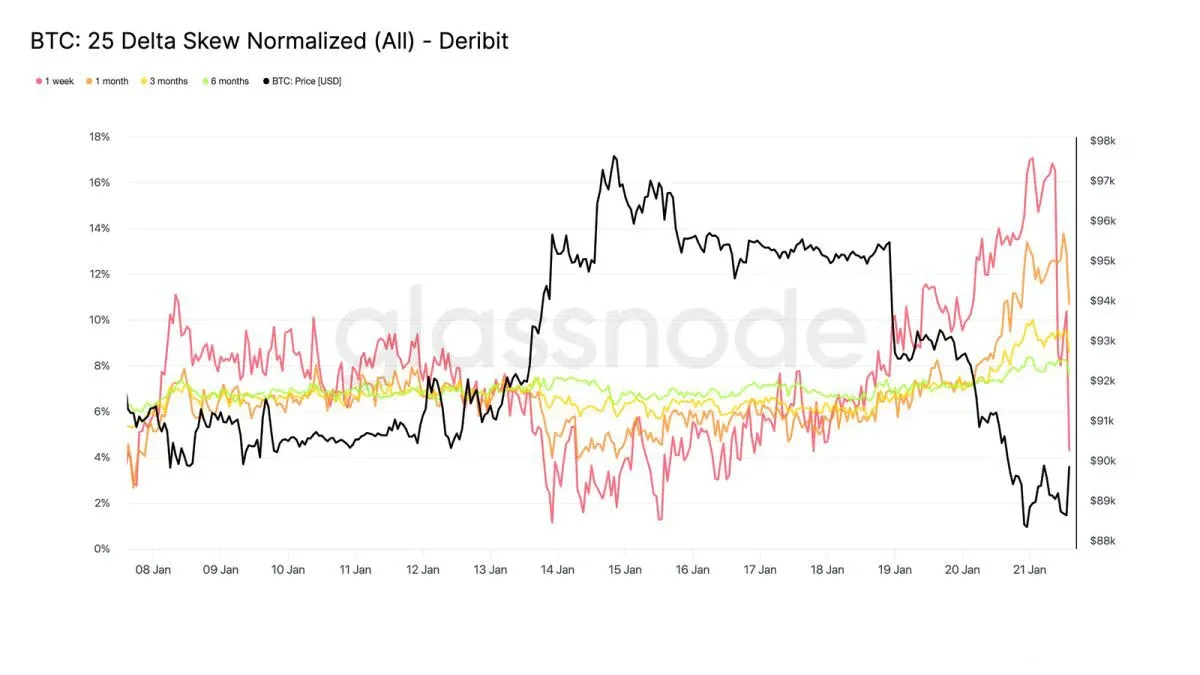
- The short‑term skew indicator recently flipped sharply bearish, showing that investors heavily purchased put options for protection.
- Medium‑ and long‑term skew remains low‑volatility, with only a mild bearish tilt.
- Extreme one‑sided sentiment often precedes heightened short‑term correction risk, making it difficult for the market to maintain a single directional trend.
Options Still Profitable
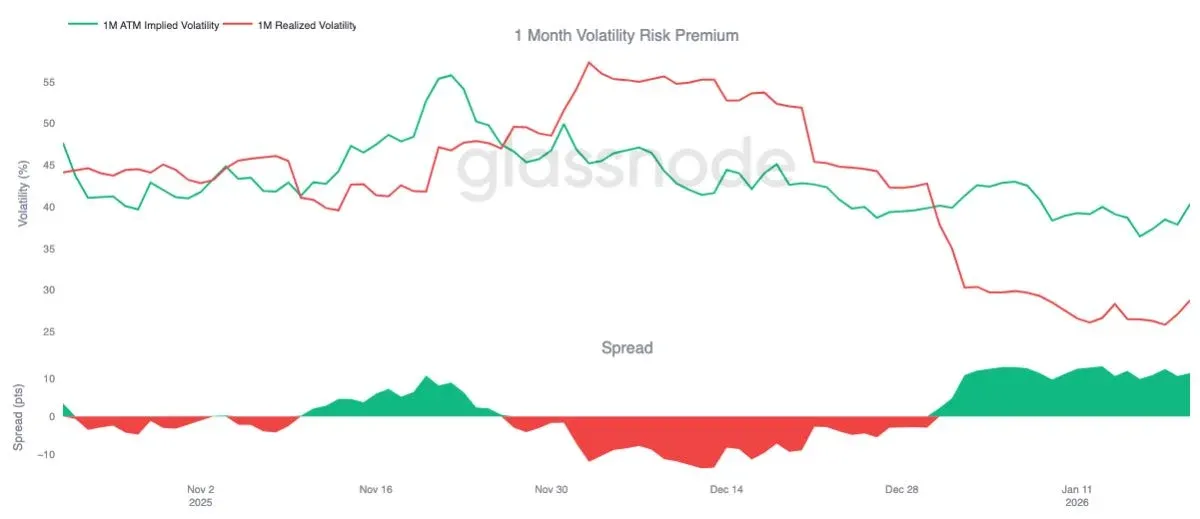
- The volatility risk premium for the one‑month contract has stayed positive since the start of the year, indicating that option prices remain elevated relative to realized volatility.
- A positive premium provides option writers with a steady stream of insurance‑type income, which in turn pushes realized volatility lower.
- As of January 20, the premium remained pronounced, favoring strategies that sell volatility.
Market‑Maker Gamma Position: No Shock Absorber Below $90k
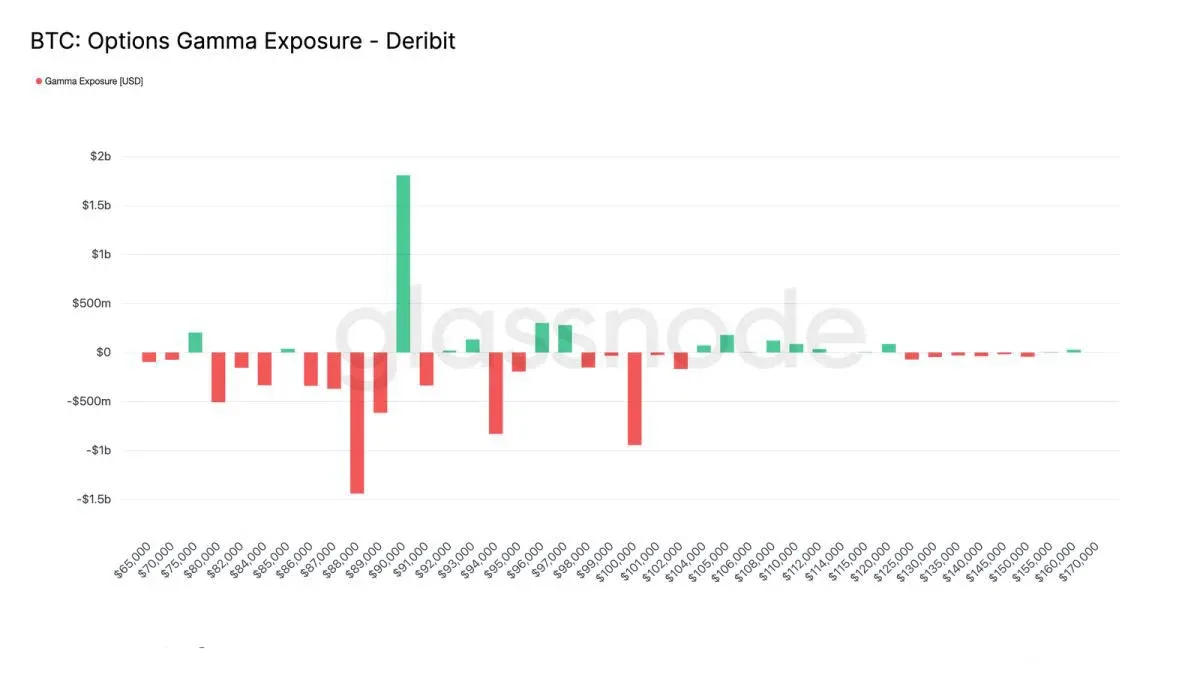
- Below $90,000, market‑makers hold negative (short) Gamma, meaning a price decline forces them to sell more, accelerating the drop.
- Above $90,000, they hold positive (long) Gamma, allowing them to sell when price rises and buy when it falls, acting as a dampener.
- Consequently, the sub‑$90,000 zone carries higher risk; a strong enough buying surge is required to push price past this level and flip the market‑maker position structure.
Conclusion
Bitcoin is currently in a low‑participation phase, with price movement driven more by diminishing sell pressure than by robust buying conviction. On‑chain data shows that upward‑locked supply continues to cap upside potential, while the support structure at the bottom remains fragile. Spot‑fund inflows are showing signs of warming, yet they have not yet coalesced into a sustained hoarding behavior.
- Institutional and corporate demand stays cautious; fund flows have settled into a “balanced in‑out” corridor and remain fragmented.
- Derivatives market volume is compressed and leverage usage is limited, resulting in thin liquidity and heightened sensitivity to modest position changes.
- The options market reflects short‑term risk‑pricing volatility, but overall premium levels stay low, suggesting overall market sentiment is relatively stable.
Overall, the market appears to be quietly building a base, awaiting the next catalyst. Participants should keep an eye on the release of upward‑locked supply, the strength of spot‑buying pressure, and shifts in market‑maker Gamma exposure to gauge the likelihood of a future breakthrough above the $100,000 threshold.
*This concludes the Bitcoin market analysis: Who is preventing Bitcoin from breaking $100,000 and what are the underlying factors?* For more material on the forces shaping Bitcoin’s price, follow Bitaigen’s other articles.
Disclaimer: Cryptocurrency gains may be taxable in your local jurisdiction; consult a tax professional for guidance.
Related Reading
- Bitcoin Wallets Explained: Keys, Security & Address Generation
- Bitcoin Crash 2026: Geopolitical Risks, Fed Liquidity Tightening & ETF Outflows
- Bitcoin Address Generation: Formats, Security & Tips
💡 Register on Binance with referral code B2345 for the maximum trading fee discount. See Binance complete guide.



