 Bitaigen Research
During the Asian trading session on Wednesday, Bitcoin rose again, breaking the $71,000 mark and edging close to the month‑high $72,000 level, with expectations of further upside.
Bitcoin breached the $71,000 threshold on Wednesday, as heightened geopolitical tension added to market volatility.
In this article we outline Bitcoin’s recent strong rally, dissect the macro forces and technical signals behind it, and assess potential moves in the next phase. Data charts and viewpoints from several institutions are used to help readers gauge market pulse and decide whether the asset is entering an accumulation stage. For a deeper dive into the market logic, please continue reading.
Key Takeaways
- Bitcoin price is brewing a new breakout; it has been unable to hold the critical $70,000 level steadily since January.
- The majority of analysts believe the large‑scale accumulation phase is about to end.
- Geopolitical focus remains on oil supply and the potential blockage of the Strait of Hormuz.
Bitcoin Jumps 5% After February Tension
TradingView data shows that on the day Bitcoin rose roughly 5%, pushing the BTC/USD pair to its highest level in nearly a month.
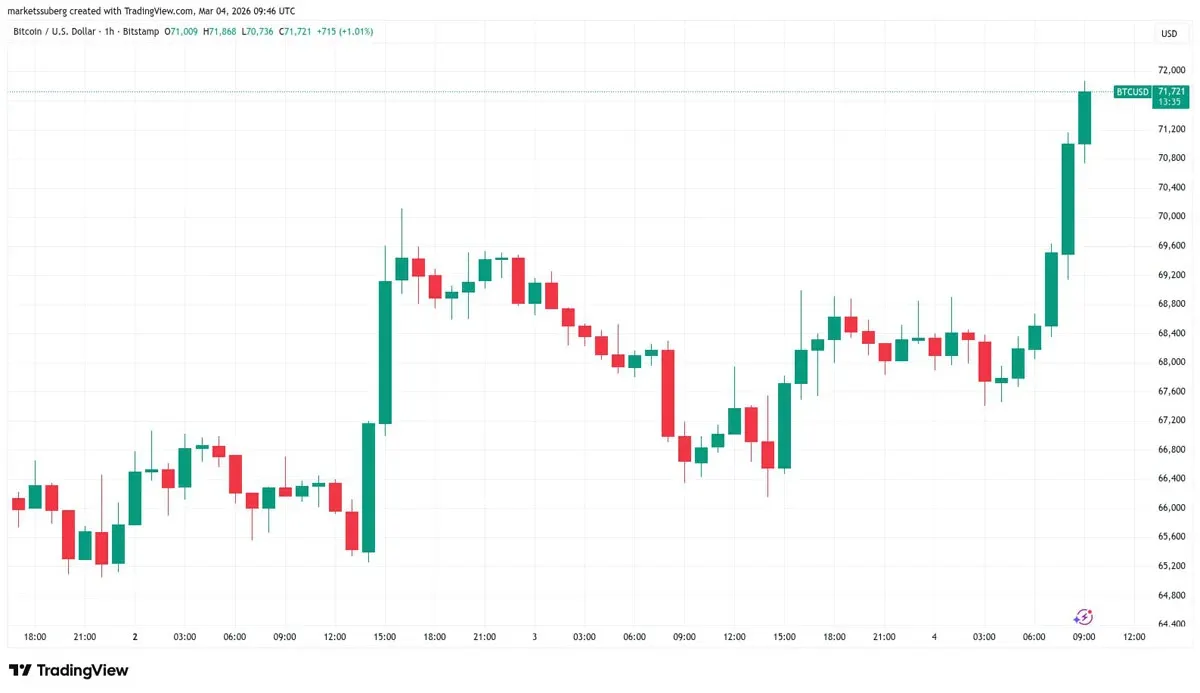
Bitcoin/USD 1‑hour chart. Source: Cointelegraph/TradingView
During the Asian session, the price quickly broke above the 200‑week exponential moving average (EMA) and the key trend line anchored at the 2021 all‑time high of $69,000.
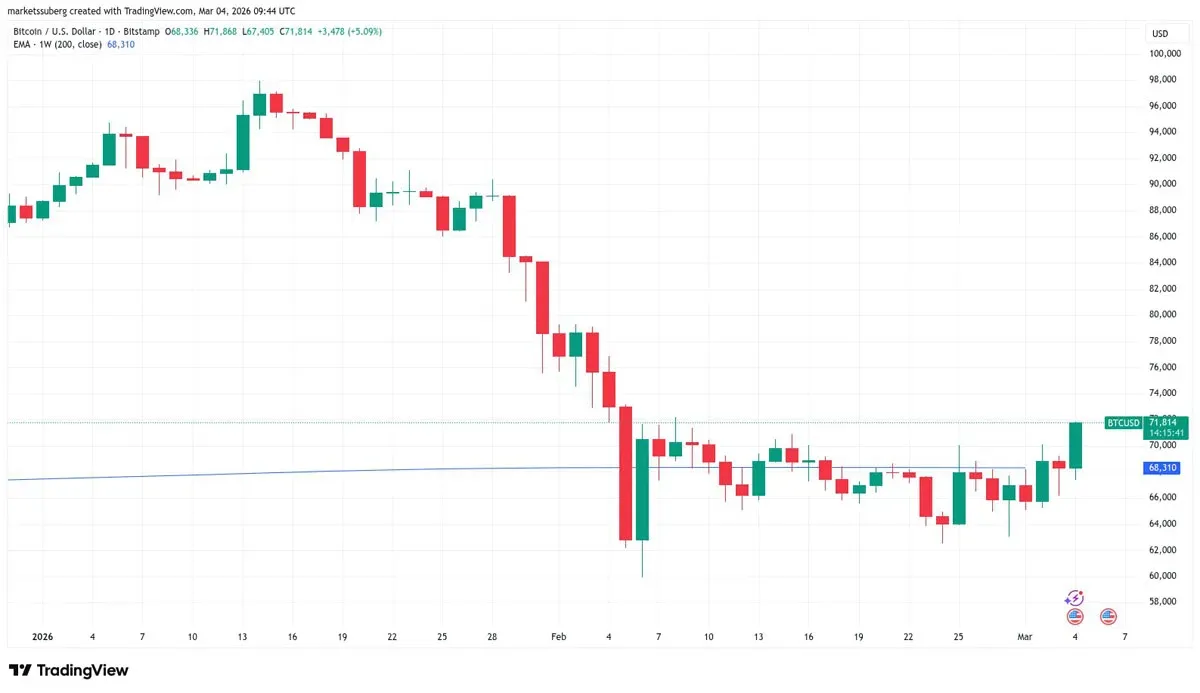
BTC/USD daily chart with 200‑week EMA overlay. Source: Cointelegraph/TradingView
Lars Kooistra (known as “Composite Trader” on YouTube) pointed out that the market is at a pivotal point of an “extremely long accumulation pattern” that is about to conclude.
“This is a decision moment. A strong breakout above the range high will attract buying liquidity; a break below the range high with a bearish breach could flip the market into a full‑blown downtrend.” — Kooistra explained to followers on X (formerly Twitter).
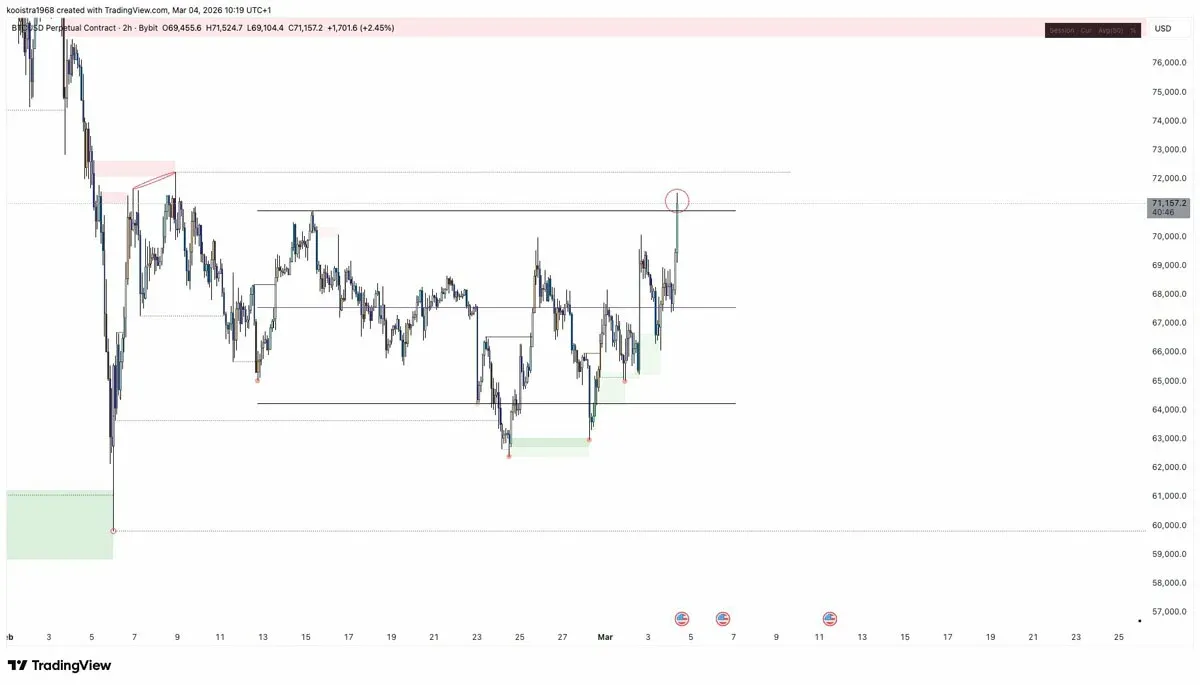
BTC/USD perpetual contract 2‑hour chart. Source: Lars Kooistra/X
Trader Alan Tadiglad added that a downward‑sloping trend line on the daily chart may be turning into a support level.
$BTC/daily #Bitcoin after yesterday’s breakout is now holding above the descending trend line pic.twitter.com/DWkYGktQzm
— Trader “Step‑by‑Step” (@TATrader_Alan) March 4, 2026
Moustache trader took a more bullish stance, believing Bitcoin’s march toward new highs has already been triggered and that altcoins could perform comparatively better.
“This is a perfect replay of the 2021 all‑time high.”
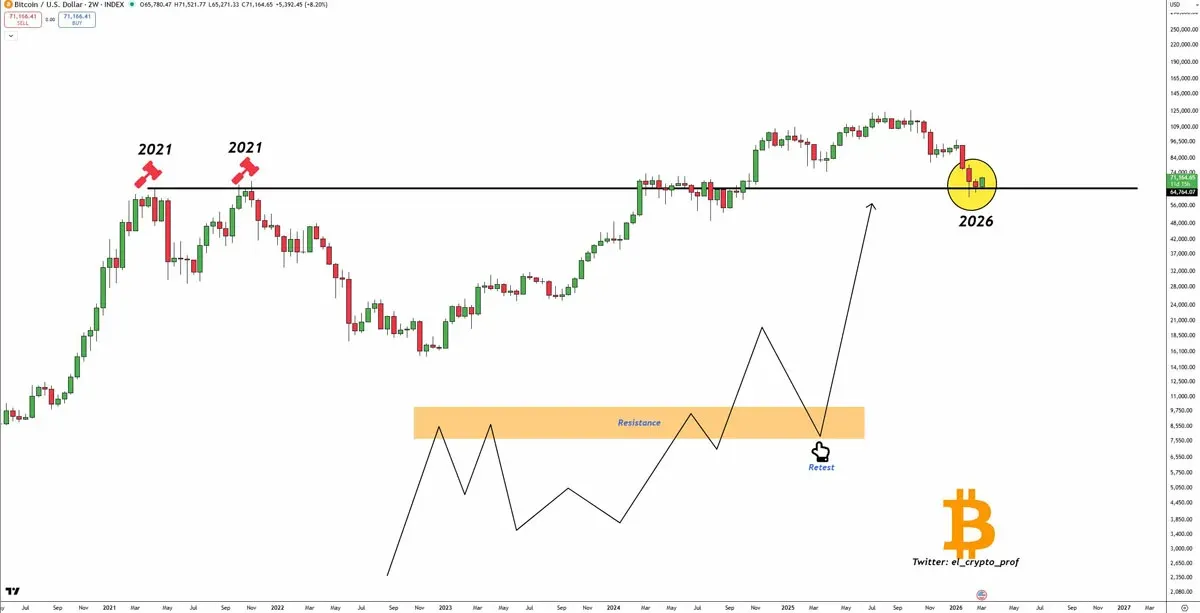
BTC/USD 2‑week chart. Source: Moustache/X
Macro View of BTC “Strength”
From a macro perspective, caution remains warranted because the trajectory of Middle‑East developments is highly uncertain.
Cointelegraph reported that the market is closely watching the outlook for oil shipments through the now‑closed Strait of Hormuz.
“If the situation drags on, the global community may collectively pressure Iran to reopen the Strait of Hormuz.” — QCP Capital’s Market Outlook released Wednesday.
QCP interprets Bitcoin’s recent vigor as a possible signal of renewed risk appetite.
“Energy is a critical input for modern industry and AI supply chains. Any disruption to supply instantly impacts inflation expectations, manufacturing confidence, and risk pricing.”
“We anticipate further market turbulence over the coming week, but Bitcoin’s strength could become an early indicator of a shift in risk sentiment.”
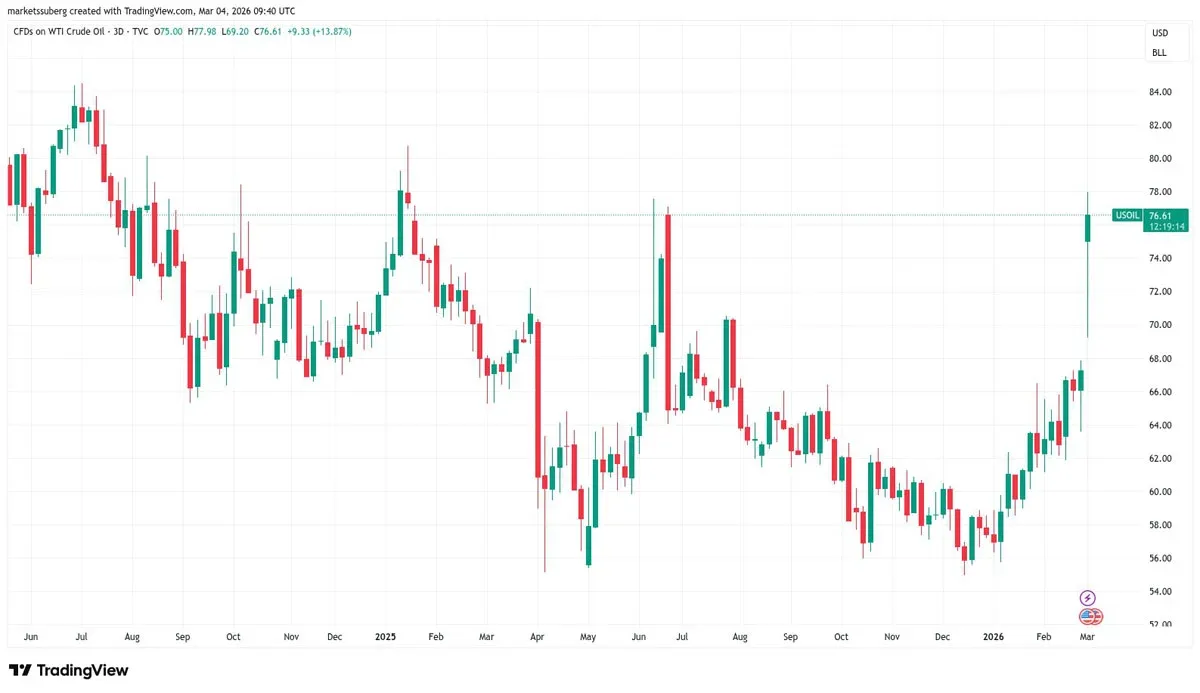
WTI crude oil CFD 3‑day chart. Source: Cointelegraph/TradingView
The above provides a detailed analysis of Bitcoin (BTC)’s strong upward movement, its proximity to the monthly high, and the trajectory toward $72,000. For more information on Bitcoin’s approach to the monthly peak and the push toward $72 k, stay tuned to Bitaigen (比特根) for additional articles!
Related Reading
- Bitcoin Falls Below $60K – 52% Drop from 2025 $126K Peak
- Bitcoin dips below $80,000, briefly under $76,000
- Kimchi Premium Expands to Bitcoin, Ethereum & Altcoins
💡 Register on Binance with referral code B2345 for the maximum trading fee discount. See Binance complete guide.



