
Verasity (VRA) remains a high‑risk asset from 2026 through 2050; a short‑term technical bounce may occur, while long‑term recovery depends on real‑world adoption and improved liquidity.
At the beginning of 2026, the cryptocurrency market is navigating a difficult phase. Bitcoin is hovering around $60,000 for several weeks, and many low‑market‑cap altcoins are experiencing massive capital outflows. As a micro‑cap project, Verasity (VRA) feels the impact especially sharply.
Compared with its all‑time high, Verasity’s price has fallen by more than 99 %, prompting investors to ask whether the project still has the conditions for a revival or is already on the brink of long‑term survival.
Verasity aims to combat digital video‑advertising fraud using Proof‑of‑View (PoV) technology. Yet in the current market climate, actual deployment, liquidity, and trustworthiness matter more than the concept alone.
This article, grounded in data analysis, evaluates whether VRA can secure a second market opportunity, which price targets are relatively realistic, and why a “$1” scenario should be approached with caution.
We dissect Verasity (VRA) from three dimensions—technical, ecosystem, and market—assessing its potential trajectory and risks between 2026‑2050. The piece reveals whether the core technology can be realized, which factors are crucial for liquidity improvement, and offers a reasoned view of price ranges to help readers form more robust judgments in a highly volatile environment.
Verasity Price Trend and 2026 Market Conditions
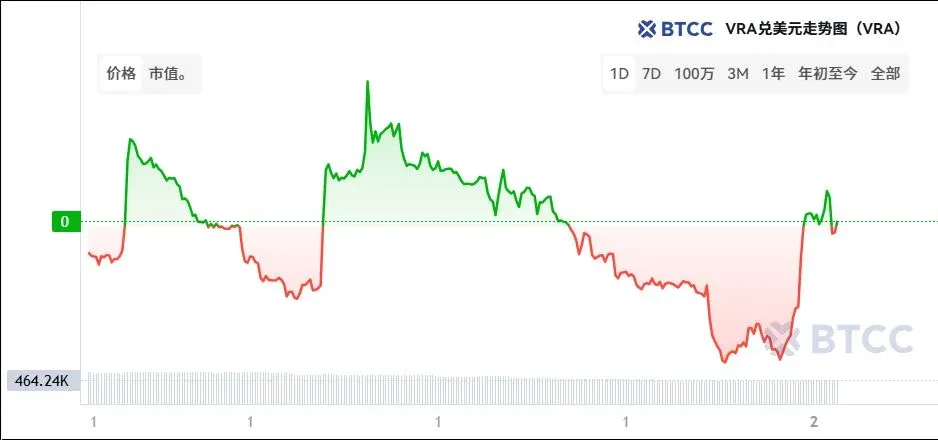
1. Recent Months’ Price Trend: Predominantly Strong Decline
As of February 27 2026, Verasity’s price is approximately $0.000022.
- The last 24 hours saw a modest rise of 4.09 %, but the effect on the overall picture is limited.
- Over the past month the price dropped about 49 %, and over the past three months the cumulative decline exceeds 92 %.
Since the start of 2026, the total decline is roughly 78 %; compared with 2025, the drop surpasses 97 %. The current price is more than 99 % below its all‑time high of $0.0868.
On February 4 2026, VRA hit a new all‑time low (ATL) of $0.000019, followed by a brief stabilization that failed to generate sustained buying momentum.
Market Capitalisation and Trading Volume: The project’s market cap is about $1.95 million, with a daily trading volume of roughly $680 k, a stark contraction from earlier valuations, indicating that both capital and attention have markedly waned.
Summary: VRA remains in a structural downtrend, but the market appears to be in a potential capitulation phase—historically, such phases often accompany technical pull‑backs near the bottom.
Technical Analysis: Selling Pressure Still Dominates, Early Stabilisation Signs Appear
- Indicator Signals: 10 sell, 8 neutral, 3 buy – selling pressure still outweighs buying, though the bearish outlook is slightly easing.
- Moving Averages: Short‑term EMA and SMA (10‑50 day) sit above the current price, issuing sell signals and confirming a classic bear‑market state.
- RSI: Around 39, out of the extreme oversold zone, suggesting short‑term stability but no clear reversal.
- MACD: Shows a faint buy signal; momentum remains negative, hinting at a possible sideways consolidation.
- Pivot Points: Central pivot near $0.00195, far above today’s level; a substantial rally would be required to neutralise the trend.
Overall, VRA’s price remains weak, showing only nascent bottom‑rebound signs on very short time frames.
Latest Authentic News
In recent months, Verasity’s primary pressures stem from liquidity, trust, and exchange listings. The fallout from the OKX delisting continues, and exchange visibility is critical for attracting institutional capital.
At the start of 2026, a controversial project update caused community sentiment to swing sharply, driving the price down roughly 45 % in a short span. Social‑media buzz subsequently faded, amplifying sell pressure.
At the same time, capital is gravitating toward large‑scale AI, Layer‑1, and real‑asset narratives, while interest in small gaming and ad‑tech projects wanes.
Nevertheless, social‑media metrics show Verasity appearing alongside several leading AI projects on the most active crypto discussion lists, indicating that the community still maintains a high level of attention and speculative interest.
- Collaboration with Fraction AI: Intended to support decentralized AI‑model training via blockchain ad‑infrastructure, boosting PoV relevance in the AI sector.
- Integration into Cwallet: Enhances global token accessibility, expanding Web3 payment and digital‑service scenarios.
While these partnerships are positive, a single collaboration is insufficient to restore trust in the short term; the market demands quantifiable business growth and genuine demand.
Verasity Coin (VRA) Price and Current Market Performance
| Metric | Value |
|---|---|
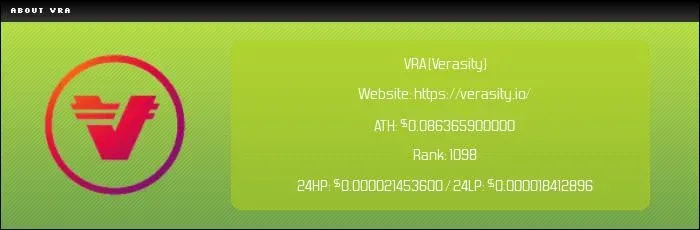
| **Price** | $0.000020953432 |
| **24 h Change** | -0.15 % |
| **Market Cap** | $1.30 million |
| **24 h Volume** | $0 |
| **Rank** | 1,098 |
| **All‑Time High** | $0.0863659 |
| **All‑Time Low** | $0.00000172 |
| **Circulating High** | $0.0000215585 (2026‑02‑28) |
| **Circulating Low** | $0.000017516 (2026‑02‑28) |
From a technical standpoint, VRA has entered a bear market, with long‑term moving averages trending downward and market interest sharply declining. A speculative short‑term rebound could materialise, especially on positive news or new listings, but without structural improvements any recovery would be fragile.
Trading Note: VRA currently lacks momentum‑trading characteristics and should be treated as a high‑risk speculative asset; short‑term activity is still dominated by bearish behaviour.
Verasity 2026 Forecast: How Much Development Potential Exists?
After a dramatic price plunge, the key question for 2026 is whether the price will stabilise or continue to fall. VRA is hovering near its historic lows, technical indicators show oversold conditions, and fundamentals remain strained.
1. Bullish Scenario: Technical Recovery + New Momentum
If two conditions are met, VRA could experience a notable rebound:
- Restored trust and enhanced liquidity (e.g., new exchange listings, transparent token‑economics).
- Real‑world product deployment in advertising technology or AI.
In a broader altcoin rally, low‑cap tokens often see sharp rebounds. Technically, the first target would be the $0.00010 zone, followed by a $0.00020‑$0.00023 range as a plausible next step.
- BTCC analyst bullish outlook: $0.00012 – $0.00035 (approximately 3‑8× upside).
2. Neutral Scenario: Sideways Consolidation with High Volatility
This is the most probable outcome. The market is digesting negative news, lacking clear catalysts, and the price may oscillate within a narrow band for several months.
- Support level: Around $0.00004; below that lies the historic low of $0.00000172.
- BTCC neutral forecast: $0.00003 – $0.00012.
3. Bearish Scenario: Further Liquidity Loss
If additional exchanges delist VRA or project development stalls, the downtrend will likely continue.
- BTCC bearish forecast: $0.000005 – $0.00003.
Short‑Term VRA Forecast (15 Mar 2026)
| Date | Estimated Price | Change |
|---|---|---|
| 28‑Feb | $0.000020953432 | 0.00 % |
| 03‑Mar | $0.000019453827 | -7.16 % |
| 06‑Mar | $0.000019485254 | -7.01 % |
| 09‑Mar | $0.000019483159 | -7.02 % |
| 12‑Mar | $0.000019118606 | -8.76 % |
| 15‑Mar | $0.000019401449 | -7.41 % |
These figures are derived from current technical indicators, volatility metrics, and trend models and are provided for reference only.
Verasity 2030‑2050 Forecast: Does VRA Have a Future?
Long‑term forecasts are influenced by market cycles, technological competitiveness, token‑economic structure, and capital flows.
Key Factors
- Actual adoption of ad‑tech and anti‑fraud solutions
- Stability of the token‑economic model
- Survivability across market cycles
2030 Outlook
- BTCC projected range: $0.0002 – $0.0025.
- If VRA can attract speculative capital during the 2028‑2029 altcoin cycle, valuation may rise, though re‑touching its all‑time high remains unlikely.
2040 Outlook
- BTCC projected range: $0.001 – $0.01.
- Preconditions include sustainable revenue streams, regulatory adaptation, and successful integration with AI ecosystems.
2050 Outlook
- BTCC projected range: $0.0005 – $0.02.
- The upper bound assumes global market integration and multiple successful innovation cycles; the lower bound reflects a scenario where the project survives only within niche markets.
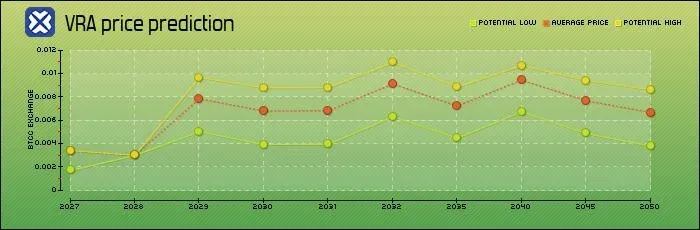
Annual Forecast Table (2027‑2050)
| Year | Low | Average | High |
|---|---|---|---|
| 2027 | 0.00171485 | 0.00341980 | 0.00342378 |
| 2028 | 0.00300436 | 0.00301138 | 0.00301491 |
| 2029 | 0.00504584 | 0.00785783 | 0.00968545 |
| 2030 | 0.00393612 | 0.00680851 | 0.00879829 |
| 2031 | 0.00396823 | 0.00683420 | 0.00882023 |
| 2032 | 0.00631594 | 0.00913884 | 0.01097312 |
| 2035 | 0.00448789 | 0.00724306 | 0.00886969 |
| 2040 | 0.00673826 | 0.00945619 | 0.01070905 |
| 2045 | 0.00488781 | 0.00770342 | 0.00942851 |
| 2050 | 0.00380700 | 0.00668167 | 0.00864279 |
Verasity Bull Market Projection: Can It Reach $1?
Every strong bull market prompts the question: “Can VRA ever hit $1?”
BTCC analysts conclude that, given the current structural conditions, a $1 target is virtually unattainable. Mathematically it isn’t impossible, but from a market‑cap and fundamentals perspective there is insufficient support.
- All‑time high: Approximately $0.086.
- If $1 were reached, market cap would climb into the hundreds of billions of dollars, a level only the top 50 projects worldwide achieve.
- Attaining such a valuation would require a dominant role in the global digital‑advertising market, substantial revenue generation, and broad institutional and regulatory acceptance.
More Realistic Bull‑Market Range
- BTCC projection: $0.002 – $0.02.
- This band still represents multiple‑to‑tens‑fold upside from current levels, yet aligns better with the overall market structure than a $1 target.
VRA Fundamental Outlook
| Category | Assessment & Analysis |
|---|---|
| **Project Positioning** | Provides blockchain infrastructure for digital advertising, video ecosystems, and ad‑fraud prevention. |
| **Core Technology** | **Proof‑of‑View (PoV)** validates genuine video views on‑chain, aiming to eliminate bot traffic. |
| **Market Environment** | The global digital‑advertising market continues structural growth; demand for transparency and anti‑fraud solutions is rising, giving PoV potential relevance. |
| **Market Penetration** | Large‑scale deployments remain limited; success hinges on integration with mainstream ad platforms. |
| **Ecosystem** | VeraWallet offers staking, which can boost returns during bull markets but struggles to counteract sell pressure in bear markets. |
| **Token Economics** | Fixed supply cap of **100 billion** tokens; without supply reductions or demand uplift, inflationary pressure may persist. |
| **Partnerships** | Several announced collaborations with ad and video platforms; monitor actual revenue contributions. |
| **Regulatory Factors** | Data‑protection, AI regulation, and ad‑transparency requirements present both opportunities and compliance costs. |
| **Risk Factors** | Low adoption, intense competition, inflation risk, sector‑cycle volatility. |
| **Long‑Term Outlook** | Scalable real‑world usage could stabilise token valuation; otherwise, VRA remains a highly speculative micro‑cap asset. |
Key Drivers That Could Influence VRA Price
- Real‑world deployment of PoV
- Critical KPIs: number of active integrations, on‑chain transaction fees, generated ad revenue.
- Exchange Listings & Liquidity
- New listings or re‑entries on major exchanges (U.S. users should use Binance.US rather than the global Binance) can provide short‑term price lifts; delistings increase downward pressure.
- Overall Market Cycle & Bitcoin Dominance
- Small‑cap tokens typically amplify broader market sentiment.
- Token Supply Structure
- The 100 billion cap suppresses price; token burns, lock‑ups, or higher staking ratios can reduce effective circulating supply.
- Technological Advances & AI Integration
- Merging PoV with AI‑driven ad analytics could unlock new value chains.
- Regulatory Landscape
- Clear regulatory frameworks boost institutional confidence
Related Reading
- BONK Long‑Term Outlook: Market, Use‑Case & Governance
- Optimism (OP) 2026‑2032 Price Forecast & Layer‑3 Superchain
💡 Register on Binance with referral code B2345 for the maximum trading fee discount. See Binance complete guide.


