

In this article we systematically explain the principle behind the ATR indicator, dissect its role in volatility assessment, and demonstrate through real‑world examples how it can be combined with trend‑line tools to help traders capture opportunities created by market swings. Continue reading for the details.
Case Study: Real‑World Use of ATR in Volatility‑Driven Opportunities
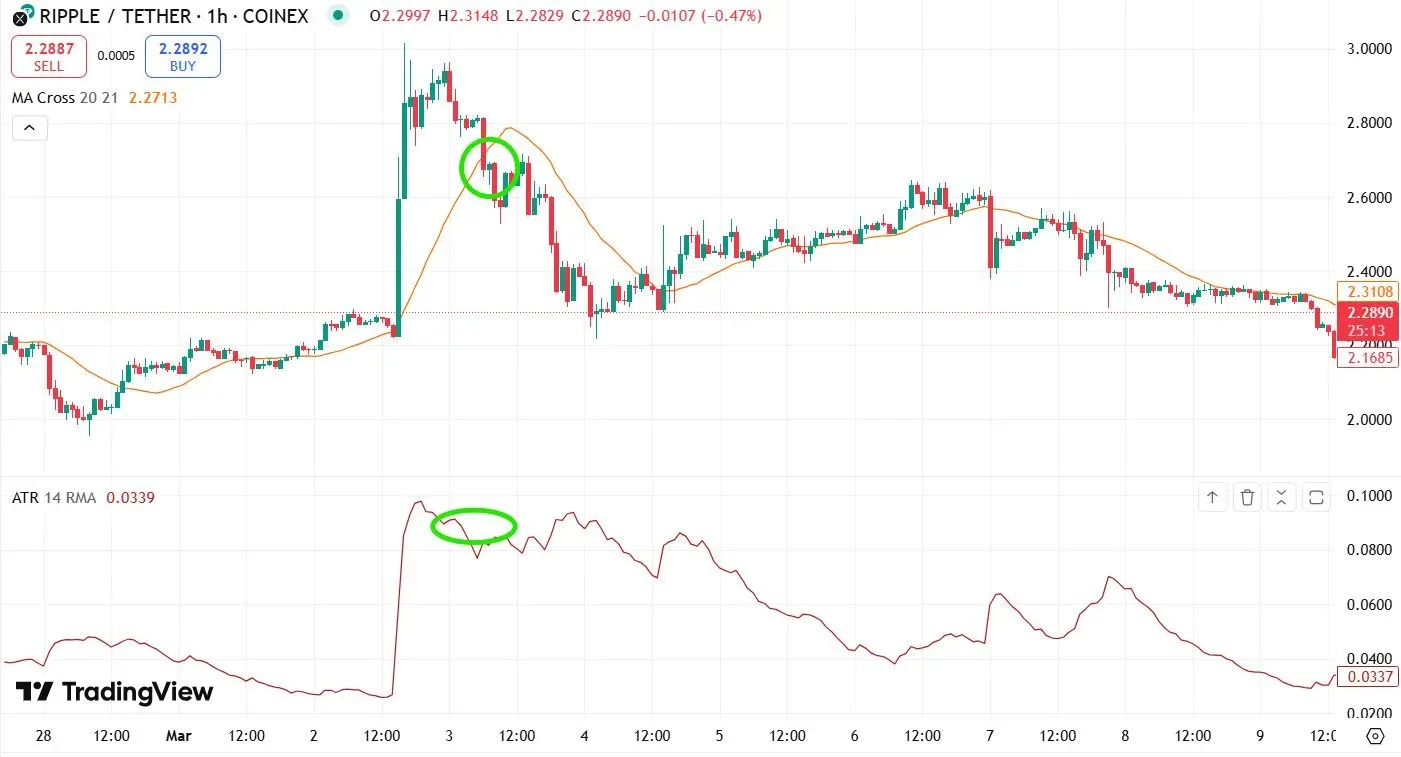
The recent price action of XRP illustrated a classic application of ATR together with trend lines. At that time XRP’s ATR spiked to 0.08, clearly signalling an increase in market volatility. Shortly thereafter the price broke below the commonly used MA20, and this breach was interpreted as a potential sell signal.
With ATR remaining elevated, the failure of the MA20 offered traders a double confirmation: an objective basis for heightened volatility and a directional cue indicating weakening trend momentum. Subsequently, XRP’s price indeed entered a down‑trend channel, and short positions entered on the basis of the above signals generated a substantial profit. This example highlights how pairing ATR with trend‑following tools such as MA20 can more effectively capture trading opportunities that arise from changes in volatility.
What Is the ATR Indicator?
Average True Range (ATR) is a volatility‑measurement tool created by J. Welles Wilder Jr. It calculates the True Range (TR) for each period (the standard setting is 14 days) and then takes the average of those values, thereby reflecting the typical price‑movement range of an asset over the selected time frame.
The TR for a given day is the maximum of three calculations:
- Current high – current low
- \|Current high – previous close\|
- \|Current low – previous close\|
After computing the TR for every trading day, the arithmetic mean of the TRs across the chosen period yields the ATR. This method incorporates both price gaps and intraday fluctuations, allowing the ATR to capture the market’s true volatility more comprehensively.
Why Is ATR Considered a Reliable Reference?
The core value of ATR lies in its ability to convert an abstract notion of volatility into a concrete number, enabling traders to adjust strategies dynamically based on the magnitude of price moves. When the ATR rises, it often coincides with breakouts, trend reversals, or major news events, indicating that the market is entering a high‑volatility phase; conversely, a low ATR suggests a consolidating or lethargic market.
The indicator works across a wide range of asset classes—including equities, forex, commodities, and cryptocurrencies. Regardless of market structure, ATR helps traders identify active periods, optimise position sizing, and set stop‑loss distances that adapt to changing volatility.
However, ATR does not provide any information about price direction, which is its principal limitation. To compensate for this shortcoming, practitioners typically pair ATR with trend‑oriented indicators (such as moving averages or MACD) to achieve a fuller market assessment.
Common Ways to Integrate ATR Into Trading Decisions
1. Coupling With Moving Averages (MA)
- Example: When ATR is rising and price is above the MA20, it can be viewed as a sign of strengthening bullish momentum; if ATR is also rising but price falls below the MA20, it suggests that bearish pressure is gaining ground.
2. Pairing With MACD
- Example: A bullish MACD crossover occurring while ATR is climbing indicates a breakout accompanied by high volatility, increasing confidence in the signal; the opposite—a bearish MACD signal together with a rising ATR—confirms strong selling pressure.
3. Assessing the Strength of Trend‑Line Breakouts
- Example: If price breaks an upward trend line and ATR expands noticeably, the breakout can be judged as robust; if ATR remains low after the breach, traders should be wary of a possible false breakout.
By employing these combinations, traders can filter out noise, verify trend direction, and pinpoint entry and exit moments with greater precision.
Limitations of ATR
- Lack of Direction: ATR only reflects the magnitude of price movement; it does not indicate whether the market is moving up or down. Using it in isolation can lead to misinterpretation, especially in sideways markets that exhibit high volatility without a clear trend.
- Relative Nature: ATR is expressed in points or in USD, making direct cross‑asset comparison difficult. For instance, an ATR of 5 for a low‑priced stock may signify extreme volatility, whereas the same figure for a high‑priced asset could represent modest movement.
- Sensitivity to Sudden Events: News‑driven spikes can instantly push ATR higher. If traders do not differentiate between a genuine trend shift and a temporary shock, they may mistakenly assume a new trend has formed.
Strategies to Mitigate These Limitations
- Synchronise With Trend Indicators
Combine ATR with directional tools such as MA20, MA50, MACD, etc., so that volatility information is aligned with trend direction, enhancing signal reliability.
- Adjust the Period Length Flexibly
- A 7‑day ATR reacts quickly to volatility changes but can be noisy.
- A 20‑ or 30‑day ATR smooths out fluctuations, producing more stable signals at the cost of potential lag. Traders should experiment based on the characteristics of the underlying instrument and their own trading frequency to identify the optimal window.
- Risk Management Based on ATR
Stop‑loss methods like the Chandelier Exit set the stop distance as a multiple of the current ATR, allowing profit protection during strong trends while granting room for normal market noise.
Implementing these approaches lets traders retain the informative power of ATR while avoiding the pitfalls of using it alone, thereby integrating it as a component of a comprehensive trading system.
Conclusion
ATR is a powerful gauge of market volatility that helps traders recognise periods of increasing or decreasing price movement across a variety of asset classes. It can be used to adjust position size, set dynamic stop‑loss levels, and evaluate the vigor of breakouts. However, because ATR does not convey price direction, it must be paired with trend‑following indicators such as moving averages or MACD to generate actionable signals.
When incorporated into a systematic trading framework—combined with appropriate period settings and robust risk‑management techniques—ATR enables traders to capture opportunities arising from volatility shifts while keeping risk under control. Understanding both the optimal timing and the inherent limitations of ATR is essential for unlocking its full potential in volatility‑driven trading strategies.
---
This article focuses on “What Is the ATR Indicator? Volatility Analysis, Trading Applications, and Practical Cases”. For further details on ATR, you may search for previous Bitaigen (比特根) articles or continue reading the recommended content below. Thank you for following and supporting Bitaigen (比特根)!
Note for U.S. readers: When accessing cryptocurrency exchanges, U.S. residents must use Binance.US rather than the global Binance platform. Fiat deposits and withdrawals are typically handled via USD through SEPA (for Euro‑based accounts) or SWIFT (for international wires). Additionally, crypto gains may be taxable under the local jurisdiction; please consult a tax professional for guidance.
💡 Register on Binance with referral code B2345 for the maximum trading fee discount. See Binance complete guide.


