
Bitcoin’s performance in March might seem like a straightforward topic at first glance, but it quickly turned into a statistical discussion. March is typically regarded as a strong month, yet some traders are focusing on a particular pattern: when February closes with a red (negative) candle, March often ends the same way.
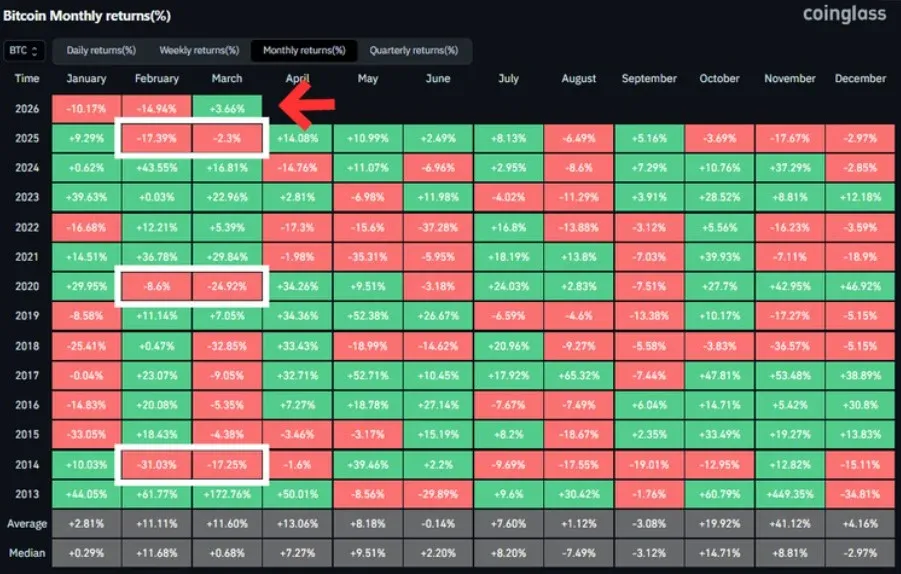
In February 2026 the decline was 14.94 %, while the first few days of March 2026 saw a rise of about 3.66 %. Consequently, a common question arises: will Bitcoin finish March 2026 in the red, or will it shake off the poor February trend and close green?

We examine Bitcoin’s March trajectory from two major angles—seasonal returns and on‑chain signals. The article evaluates the reliability of historical patterns, assesses how a red February could influence March’s close, and integrates macro‑economic factors to provide a multi‑faceted view that helps readers form a rational outlook on this month’s market. For the full details, keep reading.
Key Takeaways
- March’s average performance is positive, but the subset of years with a red February shows a negative average for March.
- The “red‑February → red‑March” pattern is based on only three historical instances, making it a hint rather than a hard rule.
- March 2026 faces seasonal bearish pressure, yet some macro and on‑chain signals could support a rebound.
Bitcoin’s Seasonality and the Typical March Profile
Bitcoin seasonality refers to recurring monthly return patterns observed in historical data. It does not imply that the market follows a magical calendar; instead, analysts look at base rates and explore conditions that might shift those rates.
According to Coinglass’s monthly return data, March’s average return is about 11.60 %, with a median of roughly 0.68 %. The contrast between the two figures is meaningful.
When the mean is high but the median is low, a few exceptionally strong months pull the average up while most months hover near flat. In plain terms, March usually delivers a “slight positive” outcome, but it rarely produces dramatic spikes.
The best way to use seasonality is as background context, not as a direct trigger. This avoids lazy assumptions such as “bad February means a bad March” or the opposite “March is always good, so buying is forever safe.” Macro news, liquidity shifts, leverage levels, or single‑event shocks can all alter market direction, and seasonality cannot prevent those changes.
Seasonality remains relevant because traders incorporate it into positioning. If enough participants expect a strong March, they may buy ahead of time, creating upward momentum at the month’s start.
Conversely, if many worry that a red February will spill into March, they might sell on any rebound, potentially generating the weak performance they anticipate. This illustrates why understanding the limits of the numbers behind the story is crucial.
Red February and Red March: How Strong Is the Pattern?
The claim is simple: every red February is followed by a red March. Some social‑media posts even phrase it as “history shows March will end in the red.”
The key issue is sample size. The existing data contain only three instances of a red February:
- 2020: February ‑ 8.6 % decline, March ‑ 24.92 % decline
- 2014: February ‑ 31.03 % decline, March ‑ 17.25 % decline
- 2025: February ‑ 17.39 % decline, March ‑ 2.3 % decline
There is some basis for the observation, but it is far from a hard‑and‑fast rule. Three cases can hint at a trend, yet they cannot prove reliability. Moreover, each occurred under very different macro environments—for example, the global risk events of 2020. Consequently, the pattern might capture genuine dynamics, or it could simply be a coincidence of timing.
February 2026 fell 14.94 %, a decline that sits between the February drops of 2020 and 2025. March 2026 opened with an approximate 3.66 % gain, which looks encouraging on the surface, but early‑month rallies do not guarantee a positive month‑end close.
Practical Checklist: 7 Ways to Read This Pattern Without Blindly Reacting
- Treat it as a warning label, not a definitive forecast.
- Compare baseline rates: despite the negative subset, March’s overall average remains positive.
- Respect the small sample: a new regulatory regime could render the three cases obsolete.
- Watch volatility: the largest red‑March swing occurred in a crisis year.
- Separate direction from path: March may rebound mid‑month yet still close red.
- Use position sizing and risk limits instead of pure gut feeling. “Pattern shows red” is not a trading plan.
- Update your view weekly. Seasonal shifts are slow, but price moves can be swift.
Factors That Could Break the Pattern in March 2026
A balanced assessment requires looking at two angles: seasonal pressure and current market conditions.
First, momentum indicators show that March 2026 opened with roughly a 3.66 % rise, suggesting buyers are still active, though no conclusion can be drawn yet.
Second, several macro and on‑chain metrics are cited as supporting a potential mid‑term rebound. The analysis highlights three reasons:
- U.S. manufacturing PMI stayed above 50 for a second consecutive month, at about 52.4 in February 2026, typically interpreted as a sign of rising risk appetite.
- Monitoring the liquidity pulse between spot and derivatives markets reveals a possible “golden cross,” which could indicate sentiment turning bullish.
- Five consecutive months of red candles extended through February 2026, leading some traders to read sell‑off fatigue in the market.
No single factor can guarantee a green March. These pieces of information merely show that a subset of market participants does not view a red‑February automatically leading to a red‑March as destiny.
A prudent way to use this data is to set conditions: if March can hold key support levels and demand stays robust, the early green opening may carry through to a positive close; if support breaks and the rebound stalls quickly, the historical pattern could re‑emerge. This type of analysis, while concise, is more actionable than relying solely on the calendar.
Note for U.S. readers: When converting fiat to crypto or withdrawing to a bank account, use Binance.US (or another U.S.-compliant exchange) for USD transactions, and SEPA/SWIFT for international transfers. Crypto gains may be taxable under your local jurisdiction; consult a tax professional for guidance.
Conclusion
Will Bitcoin finish March 2026 with a loss? The answer is not binary. March’s average return sits around 11.60 % with a slightly positive median, yet the three historical instances of a red February followed by a red March demonstrate that the pattern is not inevitable.
February 2026 dropped 14.94 %, and March opened with an approximate 3.66 % gain—so the current situation remains undecided. The most important takeaway is not to predict the outcome, but to frame risk: use seasonality as context, respect the limited sample size, and let real‑time price action drive subsequent judgments.
Frequently Asked Questions
What is Bitcoin seasonality?
Bitcoin seasonality studies historical monthly return patterns to see whether certain months tend to be relatively stronger or weaker over time.
Is March usually a good month for Bitcoin?
In the available data, March’s average return is positive—about 11.60 %—and the median is also slightly above zero.
What do “red February” and “red March” mean?
They refer to the three past cases where a negative (red) close in February was followed by a negative close in March.
How did February 2026 perform?
According to monthly return data, February 2026 fell roughly 14.94 %.
Why do some analysts still see upside potential for March 2026?
They point to macro and on‑chain signals such as a PMI consistently above 50, a potential cross‑exchange liquidity pulse shift, and signs of sell‑off fatigue after several months of red candles.
---
That concludes the article. For more Bitcoin‑related content, search for Bitaigen (比特根) or continue browsing the related posts below. We appreciate your continued interest and support for Bitaigen!
💡 Register on Binance with referral code B2345 for the maximum trading fee discount. See Binance complete guide.


