
 Bitaigen Research
This article provides an in‑depth analysis of Bitcoin’s recent price fluctuations and the key technical supports behind them, combining viewpoints from several industry experts to help investors clarify the main risks and opportunities in the current market. We will examine the macro environment, on‑chain data, and sentiment indicators, revealing possible divergence paths for the future. Please continue reading for a complete interpretation.
2026 Bitcoin price forecast: Risks of breaking the $74,000 level
Recent weeks have seen the gold, silver, and crypto markets together wipe out tens of billions of dollars in value. What began as a routine correction has now delivered material blows to many investment portfolios. Bitcoin’s decline has been especially pronounced, and market sentiment has been significantly affected as a result.
After Bitcoin briefly touched a local peak of $97,924 in early January 2026, the price has since fallen roughly 24 %. This downward swing has directly altered investors’ expectations for Bitcoin’s 2026 trajectory, shifting the focus from “upside” to “drawdown.” As of 2 February 2026, BTC was trading between $74,500 and $76,000, hovering near the lows seen several months ago. That range has repeatedly acted as technical support in the past and is regarded by many traders as a relatively safe zone. However, this perception is now being challenged: can Bitcoin halt its decline around the $74,000 level and rebound, or will the support be breached further, pushing the price lower?
Expert opinions
Industry analysts broadly agree that Bitcoin’s 2026 price action will revolve around the key support zone near $74,000. Following the nearly 24 % pull‑back from the year‑start high, traders’ core concern has shifted to capital preservation rather than chasing gains. If that support is broken, the next wave of demand could gather around $69,352 and $65,863; deeper‑cycle models point to a zone near $37,500. A more optimistic view holds that, should a bounce occur, resistance may appear around $84,359 and $91,020, as those levels have historically triggered strong selling pressure. The market’s next move hinges on whether buyers continue to defend the current level or choose to sit on the sidelines.
Bitcoin price sits in a critical support area
On TradingView’s daily chart, Bitcoin is currently approaching the $20,250 low, a level traditionally seen as a strong technical support. If that support fails, the price could first dip to roughly $69,352 and then edge closer to $65,863. Both of those zones have shown active buying in the past and may become new stabilization points.
From a technical‑indicator perspective, the RSI has entered oversold territory, suggesting potential short‑term upward momentum. Such a rebound would likely be driven by short‑covering shorts or opportunistic buying on the dip, but if the rally gains traction, resistance could emerge around $84,359 and $91,020—levels that previously served as support but are now turning into sell zones.
Whales and old wallets add selling pressure
On‑chain data recently released by DeFiTracer indicates that Binance (global) has begun liquidating crypto assets worth several million USD, with large BTC and ETH transfers reaching the exchange within minutes. For traders, this information is especially critical because, in an environment of cautious buyer sentiment, it effectively introduces fresh supply to the market. *(U.S. users should use Binance.US instead of the global Binance platform.)*

Large inflows to exchanges usually signal that holders intend to sell rather than merely store their assets. If this selling pressure originates from long‑term holders rather than short‑term speculators, its impact could be even more pronounced. A report from CryptoNobler highlighted an “old wallet” that has remained untouched since the Satoshi era; after nearly 15 years of dormancy, it transferred approximately 11,000 BTC.

While the effect on total circulating supply is relatively modest, the move sends a strong psychological signal to the market. Many traders experience heightened anxiety when historically dormant wallets become active, further eroding confidence at a time when Bitcoin is already under pressure.
Long‑term support breach raises downside risk
Analyst Ted Pillows’ latest figures reveal that Bitcoin has, for the first time in this cycle, closed below its 100‑week moving average—a line that has traditionally been viewed as a long‑term trend support.
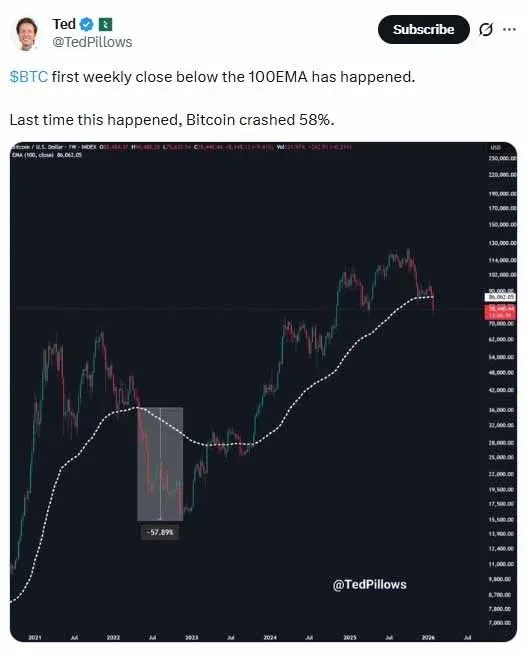
The last time Bitcoin slipped beneath this moving average, the price subsequently fell nearly 58 % before eventually stabilizing later on. History does not guarantee repetition, but such breaches often force the market to search for deeper lows before confidence can be restored. The current scenario is causing traders to question the robustness of this long‑term support.
Ali Martinez points out quarterly‑chart downside risk
Quarterly charts supplied by Ali Martinez show that, after reaching significant cyclical highs, Bitcoin has historically undergone corrections of roughly 70 %–80 % depth.
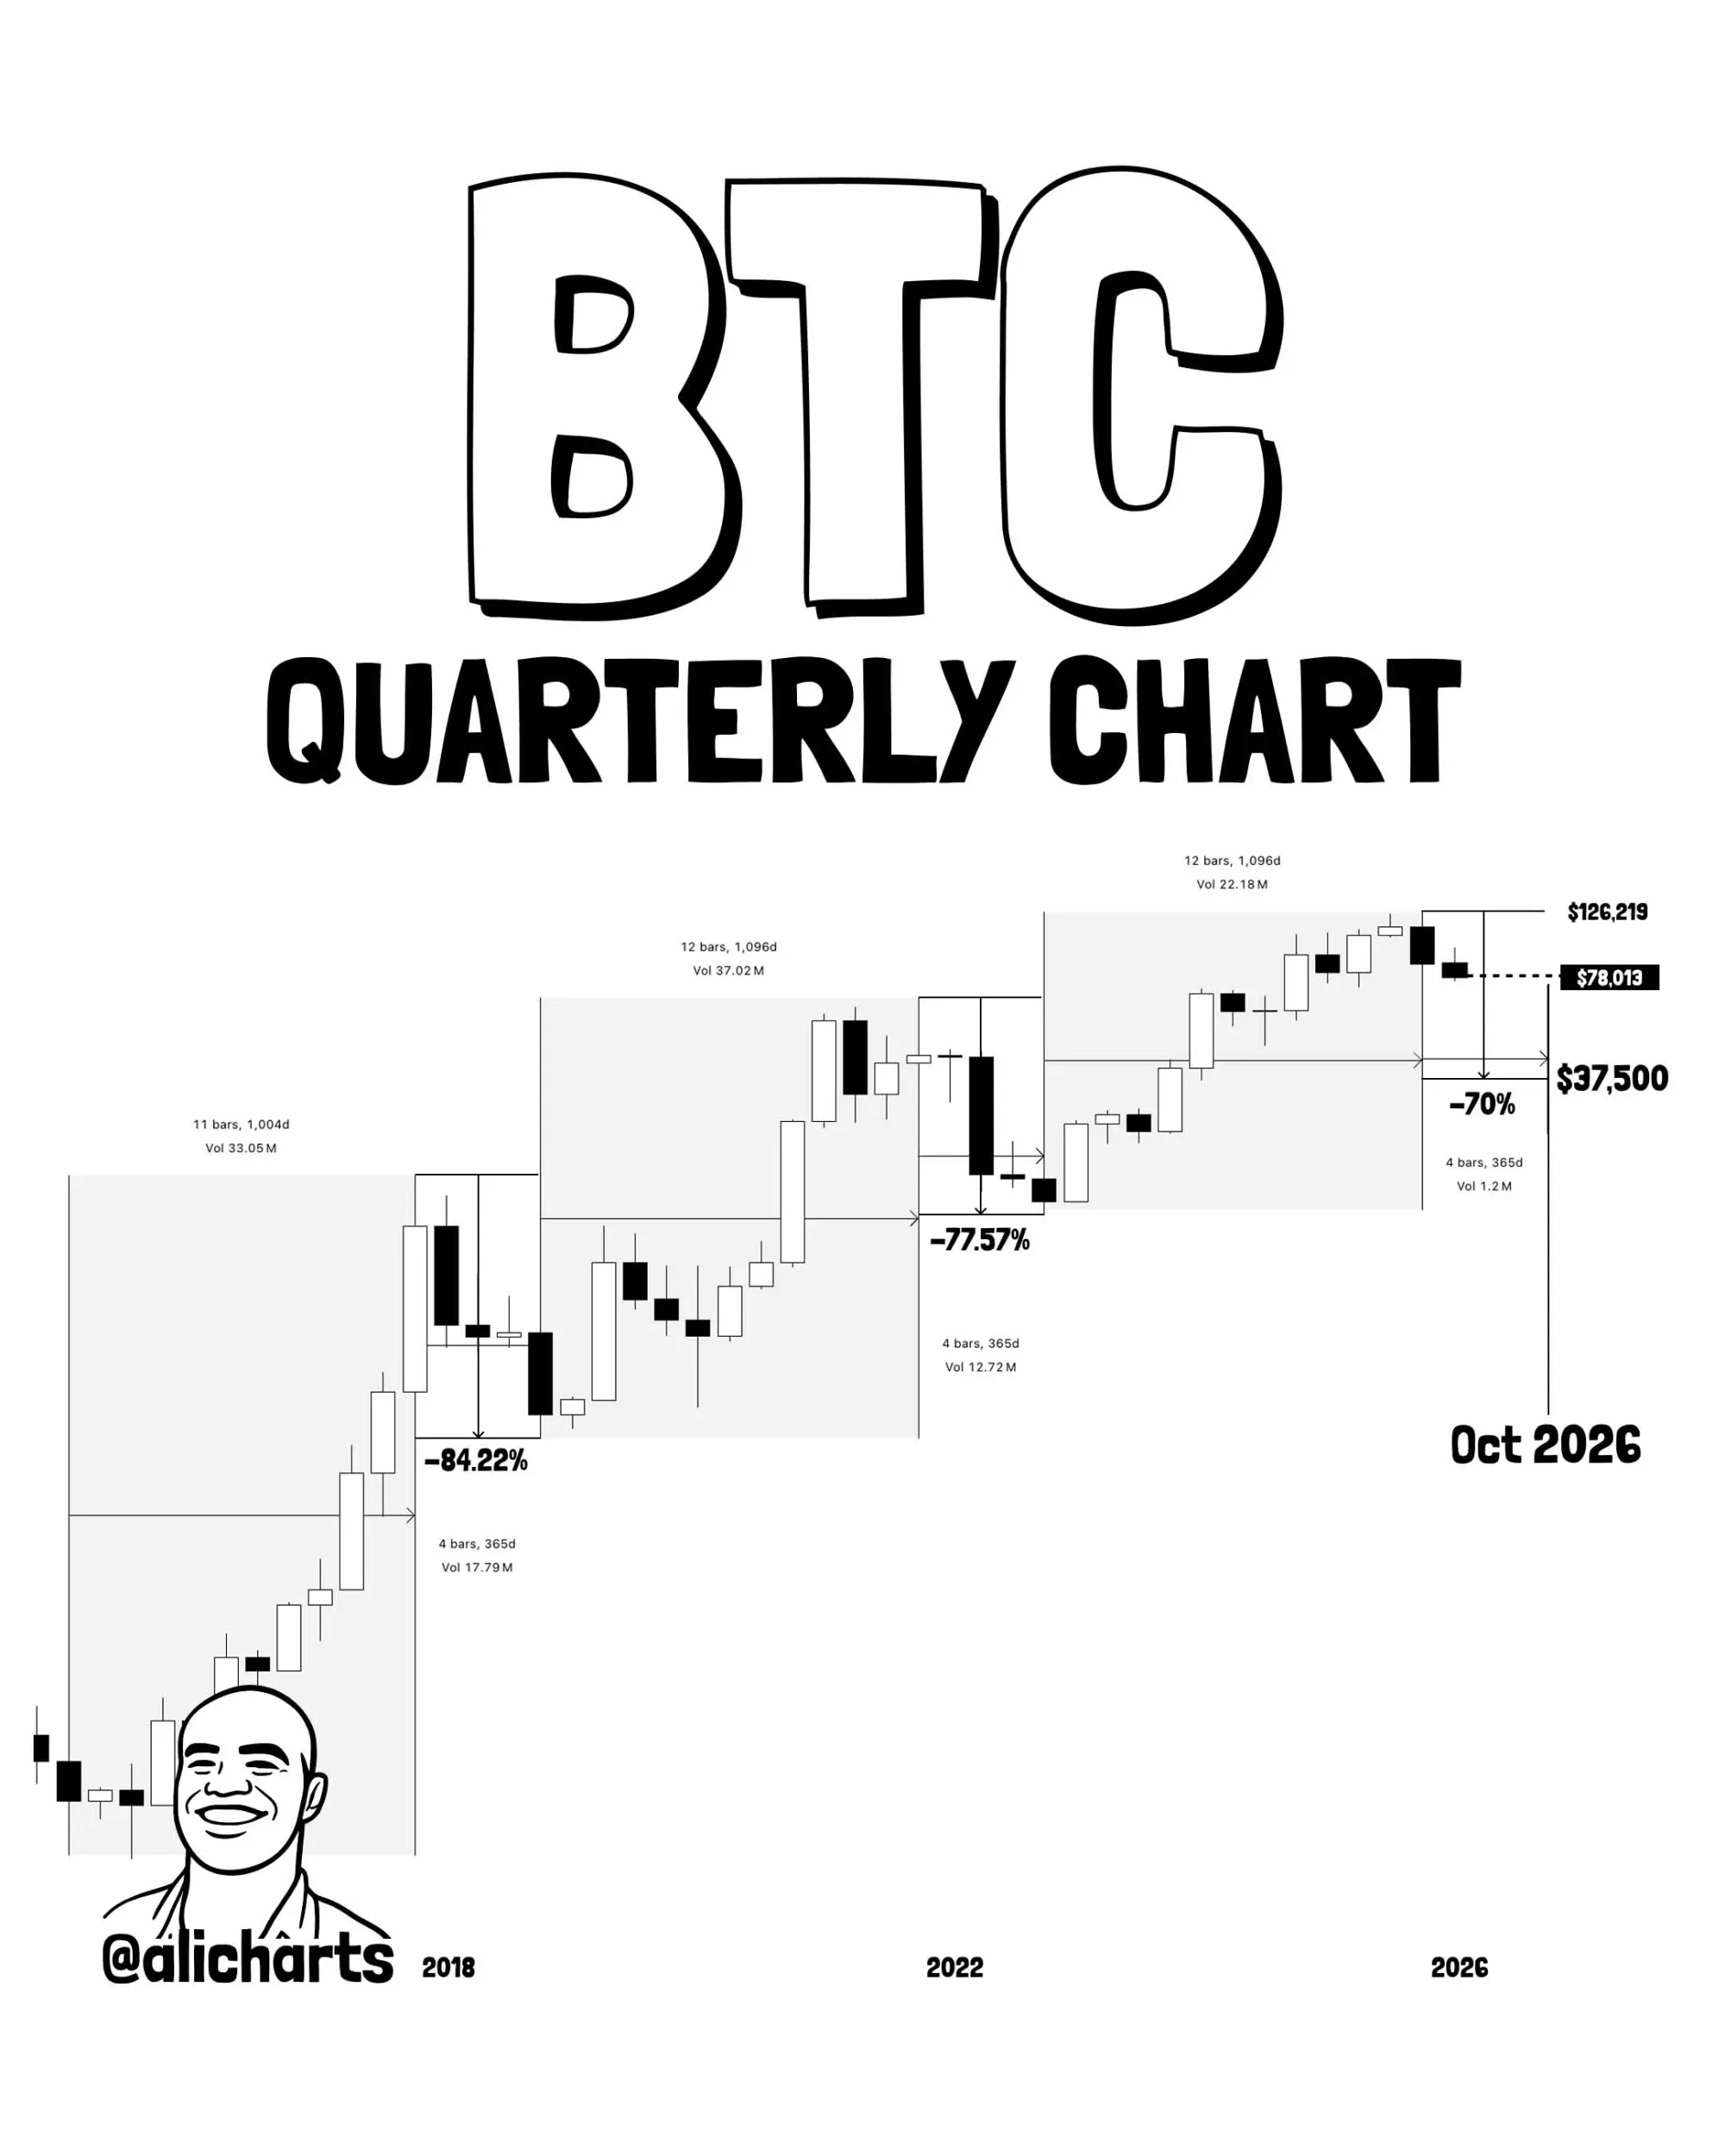
Based on this pattern, some forecasts suggest that if the market follows its historical path, Bitcoin could approach the $37,500 area by October 2026. This speculation is grounded in past cyclical behavior rather than a predetermined outcome. As market sentiment and liquidity evolve, the price structure may also adjust.
Invalidated hypothesis: If Bitcoin manages to hold the current long‑term support and retake key resistance levels on higher timeframes, the deep‑drawdown scenario described above would no longer apply. Staying consistently above the primary trend line would indicate a market leaning toward recovery rather than another historic reset.
Conclusion
In summary, Bitcoin’s 2026 price direction hinges on how it behaves around the $74,000 support zone. Technical support and resistance, large on‑chain transfers, and historical cyclical pullbacks together create a landscape of uncertainty. Investors should monitor the firmness of the support level and any emerging selling pressure to make more prudent decisions amid volatility.
*Note: Cryptocurrency gains may be taxable in your jurisdiction; please consult a tax professional for guidance.*
That concludes the article “2026 Bitcoin price forecast: Will BTC hold $74,000 or fall to $38,000?” For more Bitcoin price forecasts, search for past Bitaigen (比特根) articles or continue browsing the related links below. We hope you’ll keep supporting Bitaigen (比特根) in the future!
Related Reading
💡 Register on Binance with referral code B2345 for the maximum trading fee discount. See Binance complete guide.



