
 Bitaigen Research
 On the early morning of February 6, when Bitcoin slipped below the $60,000 mark, the entire crypto community was engulfed in an unprecedented atmosphere of tension. Compared with the all‑time high of $126,000 set in October 2025, this correction represents a drop of more than 52 %. However, if you look back over the past 15 years of price history, you will find that a 52 % decline is not unusual in Bitcoin’s history—it is more like a routine “rain”.

In this article we outline the logic behind Bitcoin’s recent sharp pull‑back, combine it with the characteristics of previous bear markets, propose three possible bottom ranges, and analyze the driving factors and risk points. By providing a systematic recap, we aim to help readers make a rational judgment about the market’s direction. Please continue reading for practical suggestions to consider.
If history repeats itself, where will this “bottom” land?
Based on the pattern that each successive bear‑market drawdown has tended to shrink, we can sketch three possible market trajectories.
Scenario 1 – Optimistic view – Maximum drawdown narrows to 65 %
Assume the ultimate drawdown for the current bear market is 65 % (12 percentage points tighter than the previous 77 % round, slightly above the historical average contraction). Then
Bottom price = $126,000 × (1 ‑ 65 %) = $44,100
From today’s $60,000 level to $44,100, there remains roughly 26 % of further downside potential.
Supporting factors
- Institutional holdings have reached a record high, and ETFs are injecting strong buying pressure.
- The Federal Reserve remains hawkish, yet the market has already priced in a June 2026 rate‑cut expectation.
- The White House crypto summit on March 7 could bring positive policy signals.
- Stable‑coin TVL is still above $230 billion, despite a slight negative growth trend.
Potential risks
- High‑leverage positions (e.g., “Strategy”) forced into liquidation could trigger a cascade of sell‑offs.
- The Trump administration’s “strategic reserve” pledge has yet to materialise, testing market patience.
Operational suggestion: If you subscribe to this scenario, consider building a position gradually below $50,000, and add more as the price approaches $45,000.
Scenario 2 – Neutral view – Drawdown stays between 70 %‑72 %
If the current pull‑back follows the historical contraction of 5‑7 percentage points, the maximum decline could land between 70 %‑72 %:
- 70 % drawdown → $126,000 × (1 ‑ 70 %) = $37,800
- 72 % drawdown → $126,000 × (1 ‑ 72 %) = $35,280
These correspond to declines of 37 %‑41 % from the peak.
Supporting factors
- Aligns with historical patterns, neither overly optimistic nor pessimistic.
- The current macro environment (rate‑cut expectations and balance‑sheet‑reduction worries) resembles that of 2018.
- The $35‑38 k range sits near Bitcoin’s 200‑week moving average, a historically strong support zone.
Potential risks
- A U.S. recession would likely trigger a synchronized sell‑off across all risk assets.
- A collapse of the AI bubble could cause a sharp correction in the tech sector, spilling over into Bitcoin.
Operational suggestion: If you lean toward this scenario, keep the core position below $40,000, with $35‑45 k as the primary accumulation band.
Scenario 3 – Pessimistic view – Drawdown returns to 75 %‑80 %
If the market structure suffers a fundamental breakdown, the decline could rise back to the average level seen between 2017‑2022:
- 75 % drawdown → $126,000 × (1 ‑ 75 %) = $31,500
- 80 % drawdown → $126,000 × (1 ‑ 80 %) = $25,200
A slide from $70,000 down to roughly $25‑31.5 k would represent a near‑50 % deep sell‑off.
Supporting factors
- The “triple‑kill” on February 6 (simultaneous crashes in U.S. equities, gold, and Bitcoin) exposed the failure of Bitcoin’s safe‑haven narrative.
- While ETFs have absorbed a large amount of supply, they also give institutions the ability to execute “one‑click” sell‑offs.
- The Trump administration’s tariff policy could aggravate global trade tensions, potentially triggering a systemic recession.
- Talent outflows and venture‑capital withdrawals (e.g., Multicoin co‑founder Kyle Samani announcing his exit) further erode confidence.
Operational suggestion: If you agree with this scenario, consider liquidating immediately, waiting for the price to dip below $30,000 before rebuilding a sizable position; alternatively, retain only 10‑20 % of your allocation as a speculative “bet” on an extreme move, moving the rest to cash.
Don’t Fear Missing the Bottom
Many investors worry that missing a bear‑market bottom will lead to regret. The answer is straightforward: you can wait for the next cycle. Crypto assets are not the only chance for a financial turnaround; treating them as the sole avenue often leads to disappointment.
- Investors who missed the $150 entry point in 2015 still had the opportunity to add on at $3,200 in 2018.
- Those who missed the $3,200 level in 2018 could still have entered at $15,000 in 2022.
The prerequisite is surviving to the next cycle. A single mistake should not be a reason to exit the market entirely.
Moreover, many focus solely on “when to buy” while overlooking “when to sell”. The three case studies below illustrate useful perspectives.
Case 1
Zhang bought heavily at $3,200 in December 2018. By June 2019 the price had risen to $13,000, and he assumed the bull run was under way, but he did not take profits. When the price fell back to $7,000 in December, he panic‑sold, ending with less than a 2× return and missing the $69,000 peak of 2021.
Case 2
Li also entered at $3,200, but set a rule: “Do not sell until the price reaches $50,000.” When Bitcoin spiked to $63,000 in April 2021, he sold half his position, locking in roughly a 15× profit. He kept the remainder and sold the whole stake at the $69,000 high in November, achieving an overall ~18× return.
Case 3
Wang started a monthly DCA of ¥1,000 (≈ $140) in December 2018, regardless of market direction, and continued for three years before stopping in December 2021. His cumulative cost was about $12,000; when Bitcoin hit $69,000 in November 2021, he liquidated everything, earning roughly 4.7×. Although his multiple is lower than Li’s, he avoided timing decisions entirely, making the strategy the simplest.
These examples demonstrate that capturing the exact bottom is less important than staying invested. If you are not planning to hold Bitcoin long‑term, pre‑defining exit targets and using a staggered buy/sell approach is the most suitable method for the average investor.
Bitcoin Bear‑Market “Drawdown Code”
The table below (see image) shows the maximum drawdown percentages of each past bear market:
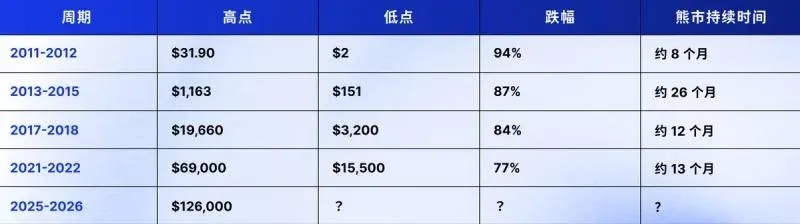
From it you can see a clear contraction trend: 94 % → 87 % → 84 % → 77 %, shrinking by roughly 5‑10 percentage points each cycle.
More detailed reductions:
- 2011 → 2013: down 7 pp (94 % → 87 %)
- 2013 → 2017: down 3 pp (87 % → 84 %)
- 2017 → 2021: down 7 pp (84 % → 77 %)
Average contraction per cycle: about 5‑7 percentage points.
Why does the contraction occur?
Larger market cap leads to natural volatility dampening
In 2011 Bitcoin’s market cap was only a few tens of millions of dollars; a single “whale” could easily trigger a 94 % plunge. By 2026, even a 50 % drop from the peak leaves the market cap above $1 trillion. To push such a massive asset down another 30‑40 % would require sell‑offs thousands of times larger than in 2011.
Institutional entry provides liquidity buffers
Before 2018, the majority of holders were retail investors and early miners, leaving little counter‑party when panic selling occurred. Since 2022, institutions such as BlackRock, Fidelity, and Grayscale have accumulated hundreds of thousands of BTC via ETFs. These holdings are far less likely to be dumped during short‑term turmoil, creating a “safety net.” Bloomberg data shows that by the end of January 2026 U.S. spot‑ETF Bitcoin holdings exceeded 900,000 BTC, worth over $70 billion, significantly reducing the amount of readily sellable supply.
Shift from speculative toy to recognized asset class
In the early days (2011‑2013) Bitcoin behaved more like a geek’s novelty, its price driven purely by sentiment. Between 2017‑2021 it was touted as “digital gold,” yet still lacked a clear valuation anchor. After 2025, with ETF approvals, the GENIUS Act advancing stable‑coin regulation, and Trump’s “strategic reserve” proposal, Bitcoin has been gradually integrated into mainstream finance. The upgrade in asset status naturally compresses price swings.
Halving‑driven supply shock weakens over time
Bitcoin’s price has historically been influenced by its quadrennial halving events. The first halving in 2012 cut the daily block reward from 7,200 BTC to 3,600 BTC, a substantial supply shock. After the fourth halving in 2024, the reward fell from 900 BTC to 450 BTC—the same relative reduction but a much smaller absolute number, thus exerting a diminished impact on the market.
The combined effect of a weaker supply‑side contraction and a cooling speculative appetite narrows the volatility band.
Final Thoughts: Bear Markets Are the Stage for the Underdogs
- Investors who bought at $2 in 2011 have realized roughly 30,000× returns (even if we take the recent $60,000 level as the bottom).
- Those who entered at $150 in 2015 have accumulated about 400× gains.
- Buyers at $3,200 in 2018 have seen approximately 18.75× returns.
- Participants who came in at $15,000 in 2022 have earned roughly 4×.
Each bear market redistributes wealth. High‑price “chasing” traders often get forced out during downturns, while panic sellers at low levels hand over chips to later entrants. The true winners are those who keep building positions incrementally while everyone else is discouraged.
If you believe Bitcoin’s intrinsic value will continue to rise, the current low levels present a solid entry point.
- When Bitcoin fell to $3,200 in 2018, some still shouted “Bitcoin is dead.”
- When it dropped to $15,000 in 2022, “crypto apocalypse” headlines resurfaced.
- When it breached $60,000 in February 2026, the world asked again: “Is this really different?”
If you concur that history tends to repeat itself, the next 6‑12 months could be a crucial window to acquire Bitcoin at relatively low prices and position yourself for the next upside cycle.
*This article concludes here. For more retrospectives on Bitcoin bear‑market cycles, search for Bitaigen (比特根) articles or continue reading the related links below. Thank you for following and supporting Bitaigen (比特根)!*
Related Reading
- Bitcoin dips below $80,000, briefly under $76,000
- Bitcoin Price Jan 3 2024: Real‑Time $45,233 Chart, 24‑Hour Change & Weekly Trend
- Bitcoin (BTC) Price Today: Real‑Time Chart & Technical Outlook
💡 Register on Binance with referral code B2345 for the maximum trading fee discount. See Binance complete guide.



