
 Bitaigen Research
In this article we outline the key milestones in Bitcoin’s evolution since its inception, focusing on how institutional adoption, liquidity stickiness, and supply scarcity may influence price dynamics over the next decade. By interpreting the data from multiple angles, readers can identify potential milestone levels worth close attention.
What Changes Have Occurred in Bitcoin's Long-Term Development?
Bitcoin has risen from a sub‑$10 starting point to nearly $126,000 – a trajectory that is far from accidental and reflects a fundamental shift in market sentiment. What was once dismissed as a purely speculative experiment is now being reevaluated by mainstream financial institutions, giving rise to a new valuation framework that is crucial for price forecasts for 2030.
- Institutional shift: Large asset managers such as BlackRock and Fidelity no longer exclude Bitcoin; they have incorporated it into strategic allocations, further cementing the foundation of long‑term demand.
- Liquidity stickiness: As institutional holders tend to lock up existing supply rather than sell frequently, short‑term market volatility is dampened and downward pressure is significantly reduced.
- Sovereign perspective: An increasing number of countries are likening Bitcoin to “digital gold” and are exploring the possibility of adding it to foreign‑exchange reserves, injecting a macro‑level boost into its long‑term cycle.
- Supply shock: Approximately 95 % of all Bitcoin have already been mined, leaving the remaining pool exceptionally limited. Should sovereign or institutional demand continue to rise, the scarcity will translate into tangible price support.
On TradingView’s weekly chart, a Fibonacci retracement drawn between the historical low and high shows the current price sitting within the 0.5‑0.618 zone, which is commonly interpreted as a healthy correction range.
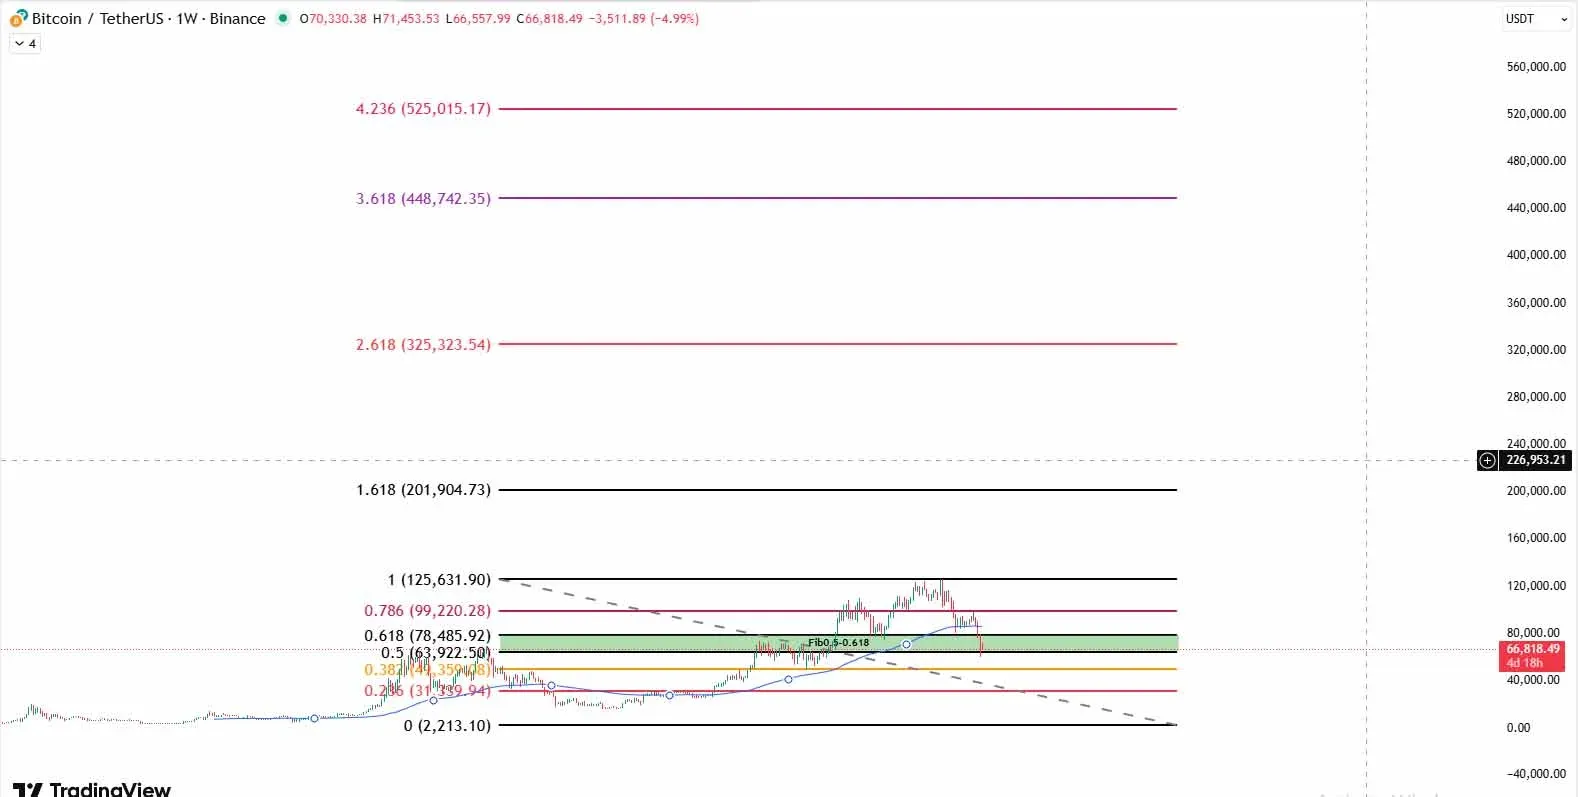
If Bitcoin stabilises within this band and begins to bounce, the next focal point will shift to the 1.618 Fibonacci level, expected to act as a major resistance/support around 2027. An extended projection to the 4.236 level points to roughly $525,015, echoing the long‑term discussion around a 2030 Bitcoin price forecast. This does not guarantee an upward move; rather, it indicates that, assuming the existing trend persists, the mathematical model still leaves room for higher prices.
Why Bitcoin's Historical Peaks Are Turning Into Bottoms
A close inspection of Bitcoin’s price curve reveals that past all‑time highs are no longer easy launchpads for declines. In earlier cycles, setting a new high often foreshadowed a steep pull‑back, yet recent behavior shows a different pattern.
After approaching the $69,000 peak, the price did not tumble sharply; instead, it lingered near that range for an extended period.
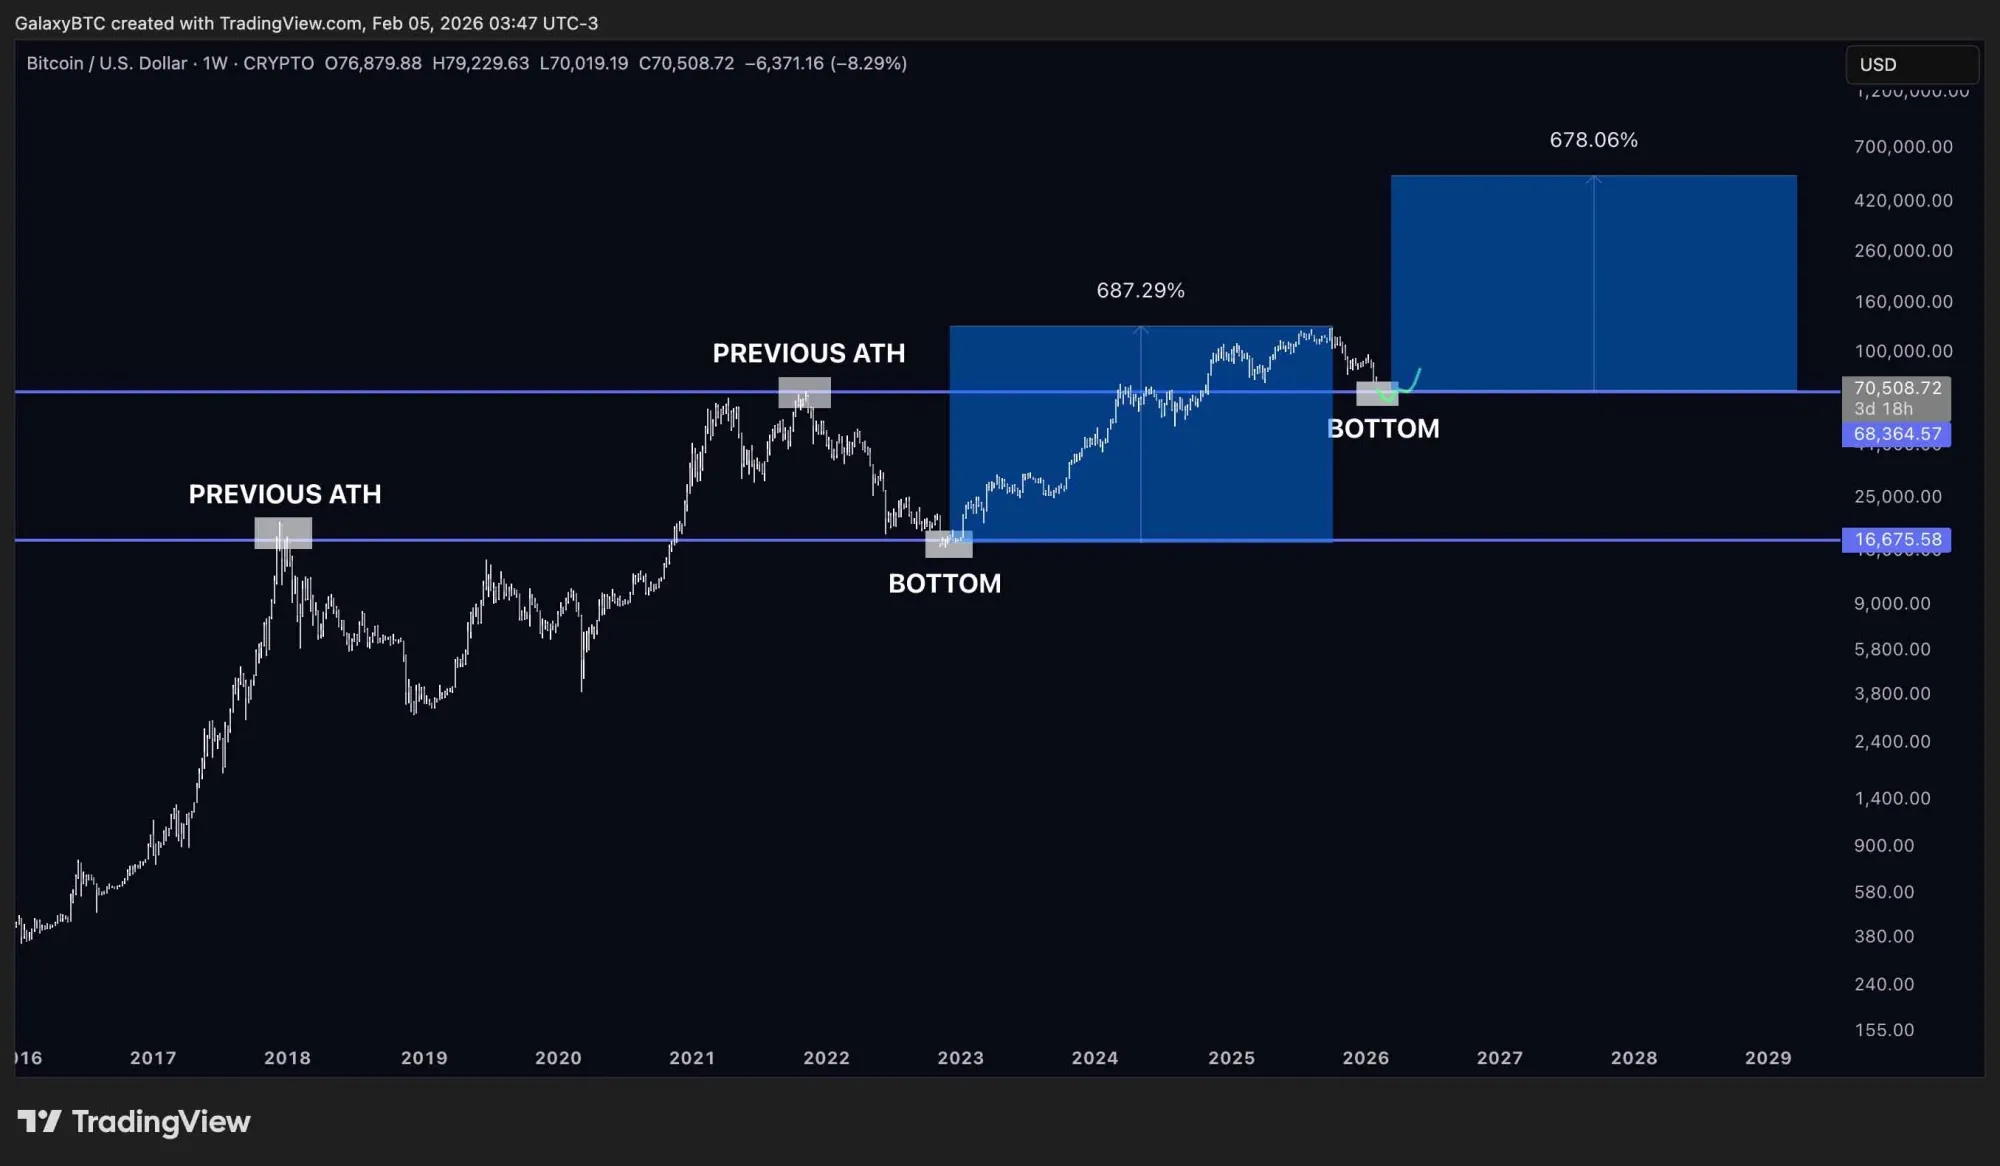
This phenomenon suggests that former resistance levels are gradually morphing into support, allowing the market to absorb downside pressure over a longer horizon. As illustrated by the GalaxyBTC chart, once a solid base is established, Bitcoin has historically rallied about 700 % from cycle lows. If a similar structure emerges around the $70,000 mark, the calculation of subsequent upside potential will also change.
Such pronounced stability has pushed the $400,000‑$500,000 band into the centre of market conversation—while not guaranteed, this range appears plausible within Bitcoin’s price architecture. From a zero‑value inception to the current vicinity of $70,000, Bitcoin has already traversed its most arduous phase. Future movements will rely more on time, patience, and the durability of the current fundamentals than on short‑term speculation.
From $10 to Global Reserves: Interpreting Bitcoin's Institutional Shift
Who could have predicted that a digital token trading at roughly $10 in its early days would eventually breach the $126,000 threshold? Bitcoin’s performance repeatedly surprises skeptics and continually reshapes market expectations. When we turn our gaze toward a 2030 forecast, the discussion transcends hype and sensational headlines.
Around 95 % of the total supply has been mined, and long‑term holders are not rushing to liquidate, creating a supply‑demand landscape markedly different from past cycles. Simultaneously, institutional investors are deepening their positions, favouring liquidity lock‑up over short‑term price chasing. Bitcoin’s long‑term outlook is no longer about “whether it can amaze again,” but whether these structural factors can sustain higher valuations over an extended period.
When the $500,000 “value corridor” enters public discourse, it is not sheer fantasy; it reflects the interplay of scarcity, holder patience, and market acceptance over the long run. This article does not promise any future events; it merely sketches a possible trajectory should crypto assets continue maturing along the current path.
Conclusion
Forecasts for Bitcoin’s 2030 price should focus on its structural characteristics and adoption breadth rather than the noise of short‑term fluctuations. Deep institutional involvement, locked‑up supply, and the healthy correction zone displayed on the weekly chart together explain why the $500,000 band has become a hot topic.
Reaching that level will hinge on time, market consolidation, and participant discipline—not on a rapid rebound. As history shows, these price zones represent potential—not inevitability—in a market that is becoming more mature yet remains highly volatile.
The above constitutes the full analysis of “2026 Bitcoin Price Forecast for 2030: Can BTC Reach the $500,000 Milestone?” For additional in‑depth Bitcoin trend analyses, please search for previous Bitaigen (比特根) articles or continue reading the related content below. Thank you for your continued interest and support of Bitaigen (比特根)!
*For U.S. residents, please use Binance.US rather than the global Binance platform. Fiat transactions can be conducted via SEPA or SWIFT.*
Related Reading
- AI‑Driven Deflation Could Push Bitcoin to $11 Million: Strive Analyst Forecast
- Bitcoin Miners Surge: Hash Rate Hits Record High
- Bitcoin Price Forecast: Technical & Sentiment Analysis Predict Consolidation
💡 Register on Binance with referral code B2345 for the maximum trading fee discount. See Binance complete guide.



