
 Bitaigen Research
 The cryptocurrency bull market is still ongoing, and based on the historical four‑year cycle, on‑chain metrics, and market capital flows, a new, significant super‑bull market is expected around 2025.
From a historical perspective, the crypto market exhibits a clear four‑year cyclicality, with price ascents and descents alternating. Grayscale Research believes that investors can monitor blockchain‑related indicators and macro variables to aid risk management and determine the current phase of the cycle. With the launch of spot Bitcoin and Ethereum ETFs, and the regulatory transparency that the incoming U.S. administration may bring, valuations of crypto assets are poised to break new historical highs. Research shows that the market is presently in the mid‑stage of a new cycle; as long as fundamentals (such as application adoption and macro‑economic conditions) remain solid, the bull market could extend to 2025 and possibly beyond.
---
Momentum Characteristics of Bitcoin Prices
Bitcoin’s price does not follow a pure random walk; it displays statistical momentum: up‑trends tend to be followed by further up‑trends, and down‑trends by further down‑trends. Over the long term, Bitcoin has shown a pronounced upward trajectory (see Figure 1).
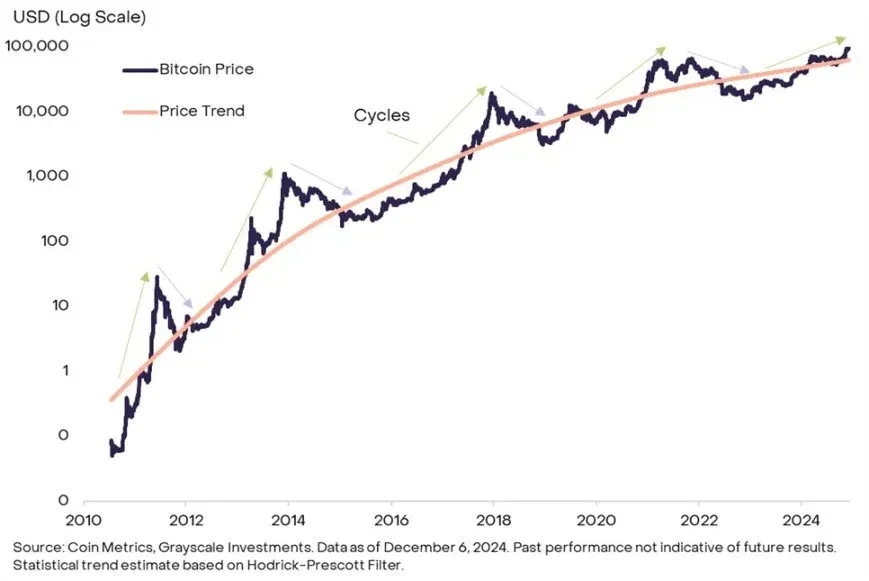
Figure 1 – Bitcoin’s price fluctuates frequently but the overall trend is upward
Each historical cycle has its own unique drivers, and future movements may not replicate the past exactly. As Bitcoin gains broader acceptance among traditional investors, the impact of halving events on supply diminishes, potentially reshaping or even eliminating the classic cyclical pattern. Nevertheless, studying past cycles provides statistical behavior references that can help investors manage risk.
---
By analysing the past four years of blockchain cycles, on‑chain activity, and the imminent launch of Bitcoin and Ethereum ETFs, we find that the bull market is still in force. This article dives deep into momentum traits and macro factors, helping readers clarify the current market stage and offering a forward‑looking view of a possible super‑bull market around 2025. For a deeper understanding of the logic and key metrics, please continue reading the full article.
Observations of Bitcoin’s Historical Cycles
Figures 2 and 3 illustrate Bitcoin’s price performance during each past rally, indexed to a starting point of 100 and scaled up to the peak.
- First cycle: less than a year, price rose more than 500‑fold from its trough.
- Second cycle: about two years, also delivering over 500‑fold gains.
- Third cycle (Jan 2015 – Dec 2017): roughly three years, with a > 100‑fold increase.
- Fourth cycle (Dec 2018 – Nov 2021): roughly three years, achieving about a 20‑fold rise.
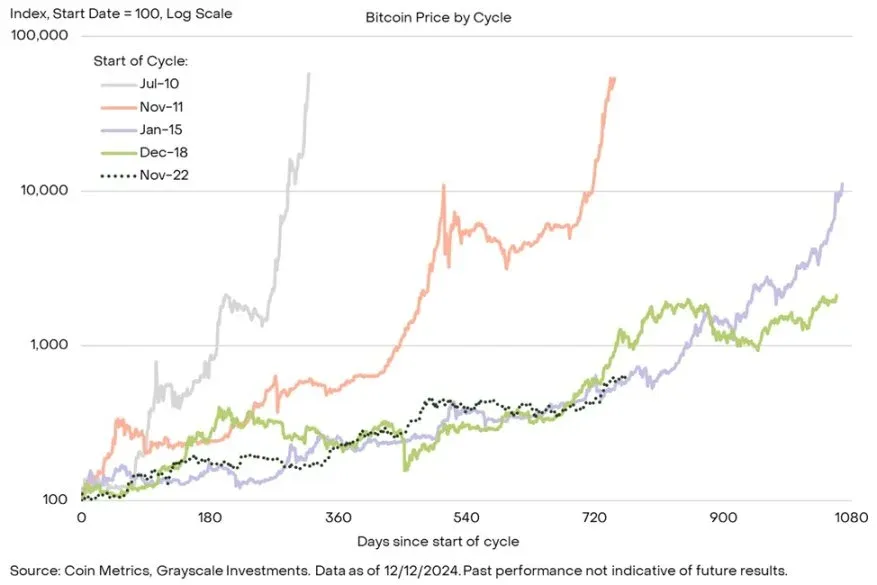
Figure 2 – Bitcoin’s trajectories in the two most recent market cycles are similar
After peaking in November 2021, Bitcoin fell to a cycle low of roughly USD 16,000 in November 2022. The current rally has now lasted a little over two years, delivering about a 6‑fold increase—lower than the returns of the first four cycles but still indicating continued momentum.
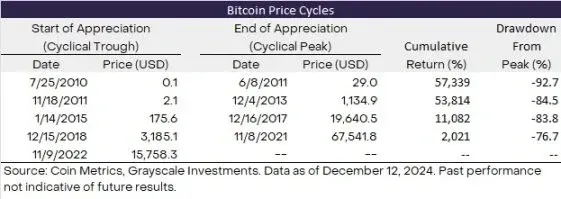
Figure 3 – Price curves of Bitcoin across four different historical cycles
---
Overview of On‑Chain Indicators
On‑chain data provides important clues about the maturity of a bull market. Commonly tracked metrics include:
- MVRV Ratio
- Definition: Market Value (MV) divided by Realized Value (RV), measuring the premium of market cap over the cost basis.
- Historical behaviour: In each of the past four cycles the MVRV reached at least 2.6; the current level is 2.6, suggesting room for further upside in the present bull phase. Peak values have been trending downward, making a return to the former 4 level unlikely.
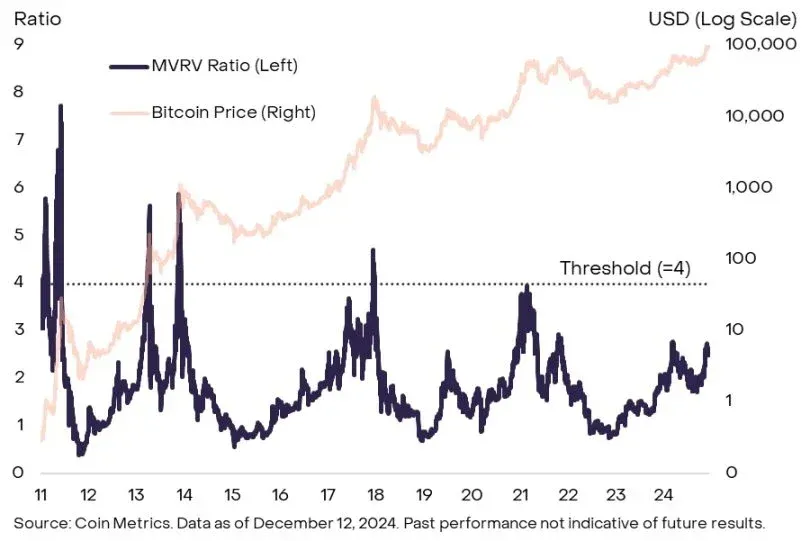
Figure 4 – Historical trajectory of Bitcoin’s MVRV ratio
- HODL Waves (Active Supply Ratio)
- Definition: Proportion of Bitcoin that has been active on‑chain over the past year relative to the total circulating supply.
- Historical threshold: All four cycles recorded ≥ 60 %. The current figure is about 54 %, indicating a sizable amount of Bitcoin remains on‑chain and could fuel further price appreciation.
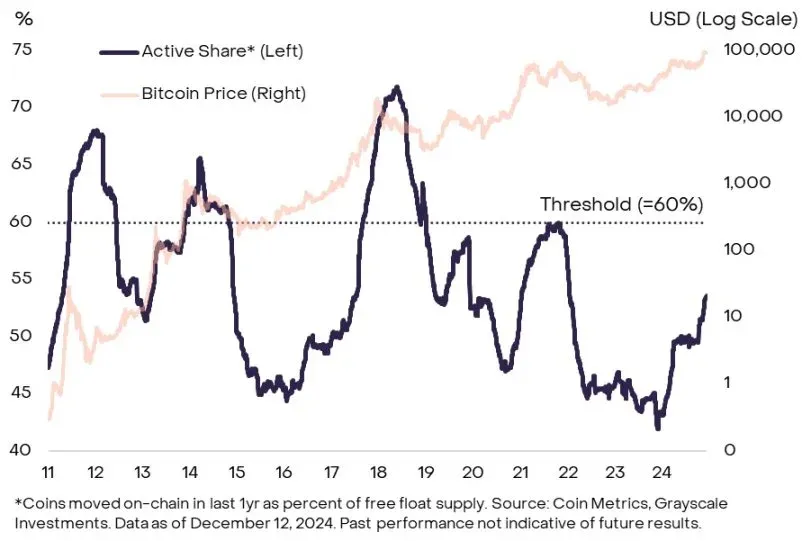
Figure 5 – Ratio of actively transacted Bitcoin to total circulating supply over the past year
- Miner Capitalization to Thermocap (MCTC)
- Definition: Miner market cap (MC) divided by “Thermocap” (TC), which aggregates block rewards and transaction fee value.
- Historical signal: When MCTC exceeds 10, prices often hover near the cycle peak. The current reading is around 6, implying the market is still in the mid‑stage, with peak levels trending lower.
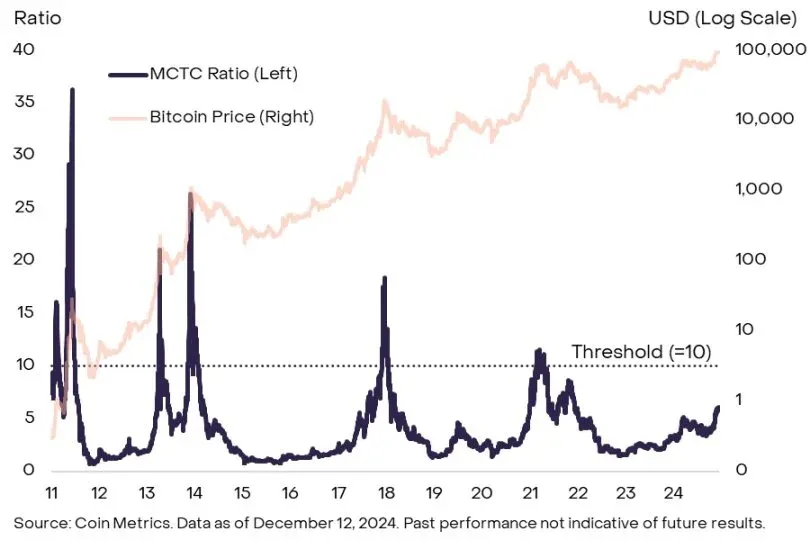
Figure 6 – Cycle‑wise trend of the miner‑centric MCTC indicator
These on‑chain metrics serve as relative guides; they do not guarantee that future returns will mirror past patterns. Overall, the current values remain below historic peaks, hinting that the bull market may still have upward momentum.
---
Additional Market Indicators
The crypto ecosystem extends beyond Bitcoin; the behaviour of other assets also reflects the cycle’s health.
- Bitcoin dominance: In the previous two cycles, BTC’s share of total crypto market cap peaked roughly two years into the bull phase before receding. We are now in the second year of that stage, and dominance is on a downtrend, signalling the need to watch broader market valuations.
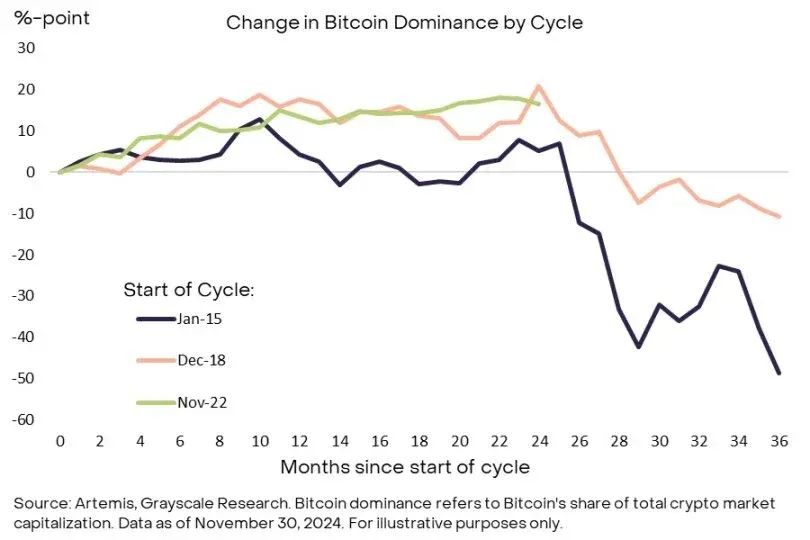
Figure 7 – Bitcoin dominance drops in the third year of both cycles
- Funding rates: The cost of holding long positions in perpetual contracts. Positive values indicate strong leveraged demand. The weighted average funding rate across the top 10 crypto assets is currently positive; although it has slipped during the recent pull‑back, it remains below last year’s levels and well under the high points of the previous cycle, suggesting speculative enthusiasm has not yet peaked.
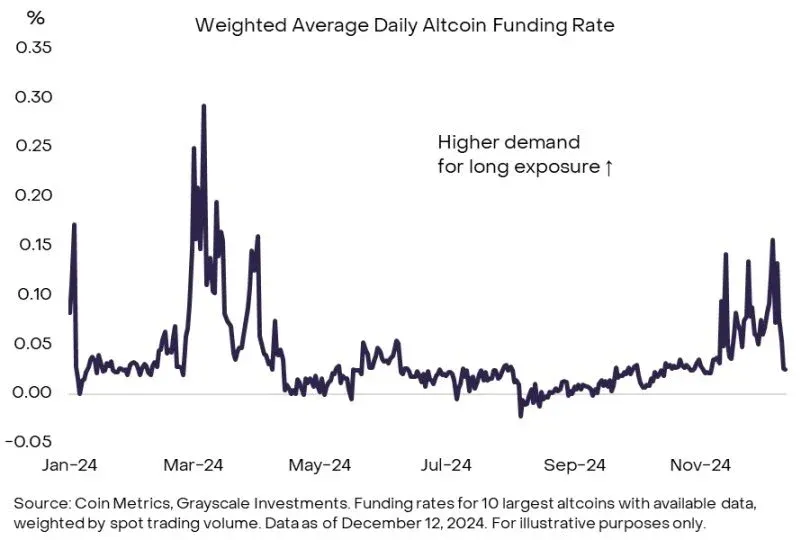
Figure 8 – Altcoin funding rates showing moderate speculation
- Open Interest (OI): Prior to 9 December, the three major perpetual exchanges recorded altcoin open interest near USD 54 billion. After a wave of liquidations, OI fell by roughly USD 10 billion but stayed elevated. High OI often coincides with the later speculative phase of a cycle and warrants ongoing monitoring.
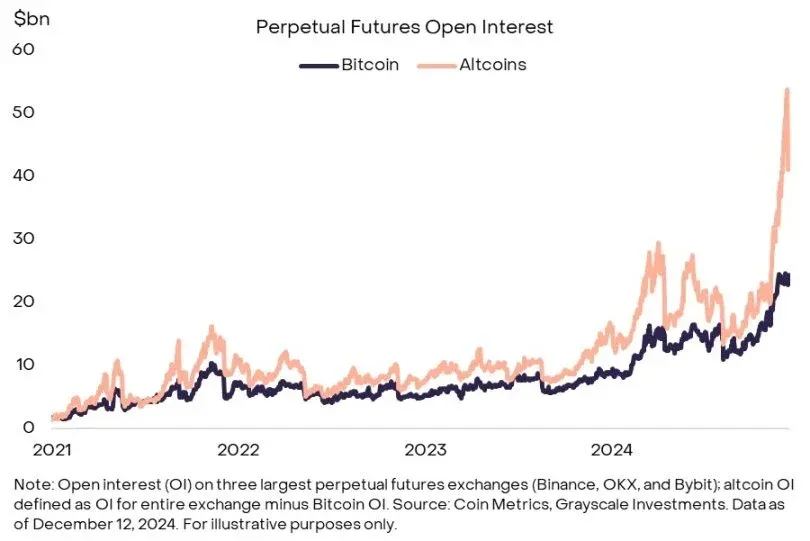
Figure 9 – Elevated altcoin open interest before liquidation events
---
Bull‑Market Outlook
Since Bitcoin’s inception in 2009, the market has matured into a more robust ecosystem. The approval of spot Bitcoin and Ethereum ETFs in the United States has attracted roughly USD 367 billion of net capital inflows, dramatically increasing the likelihood that crypto assets will become a staple in conventional investment portfolios. Moreover, the upcoming U.S. election could usher in a clearer regulatory framework, further bolstering long‑term optimism for digital assets.
The intrinsic nature of digital commodities endows them with price momentum, and on‑chain plus altcoin data remain essential tools for risk management. Grayscale Research, synthesising multiple indicators, concludes that the market is presently in the mid‑stage of a bull run: metrics such as MVRV are above cycle lows but have not yet reached historic peaks. Provided fundamentals—including application adoption and macro‑economic stability—remain solid, the bull market could persist through 2025 and beyond.
*Note for U.S. readers: Access to these ETFs and related services may be limited to platforms operating under Binance.US or other U.S.-compliant exchanges. International users can typically transact via SEPA, SWIFT, or other fiat gateways.*
---
Overview of the 7 Key Indicators
| # | Indicator | Core Meaning | Current Level | Historical Threshold |
|---|---|---|---|---|
| 1 | Four‑year cycle pattern | Prices cycle through a rise‑correction loop roughly every four years | Mid‑cycle stage | Cycle length ≈ 3‑4 years |
| 2 | Momentum metric | Persistence of price gains | ≈ 6‑fold increase | Past cycles: 20‑500 × |
| 3 | **MVRV** Ratio | Premium of market cap over realized value | 2.6 | Peaks around 4 (downward trend) |
| 4 | **HODL Waves** Active‑Supply Ratio | Share of actively transacted Bitcoin vs. circulating supply | 54 % | ≥ 60 % |
| 5 | **MCTC** Miner‑Cap/Thermocap | Miner profit level relative to cumulative rewards | 6 | Values > 10 often signal peaks |
| 6 | Dominance | BTC’s share of total crypto market cap | Declining | Peaks in year 2 of bull phases |
| 7 | Funding Rate & OI | Degree of market speculation | Positive, OI high | Funding positive, OI near historic highs |
By evaluating these metrics collectively, it is evident that the crypto market remains in a steady, mid‑term upward trajectory. If fundamentals continue to support the environment, the bull market could extend to 2025 and potentially further.
---
The above constitutes Bitaigen’s (比特根) detailed interpretation of “The crypto bull market hasn’t ended; a massive 2025 bull run is imminent,” provided for your reference. Happy reading!
Related Reading
- Crypto Market Decline Persists as Sentiment Turns Pessimistic
- Why Ethereum ETFs Struggle Without a “Digital Gold” Tagline
- Bitcoin’s Top Holder: Satoshi Nakamoto’s 1.1 Million Coins
💡 Register on Binance with referral code B2345 for the maximum trading fee discount. See Binance complete guide.
⚠️ Risk Disclaimer: Crypto prices are highly volatile. This is not investment advice.



