
Recent technical charts for Bitcoin reveal a signal worth watching: over the next few weeks the price could form a bottom around $60,000. This expectation stems mainly from the interaction of two factors – the market share of the stablecoin Tether (USDT) and Bitcoin’s own weekly chart pattern.
In this report we focus on the swing of USDT’s market share and its correlation with Bitcoin’s price formation, exposing a potential turning point that may emerge soon. By comparing historical episodes and analysing technical charts, we explain why an increase in the stablecoin’s share often signals downward pressure that helps Bitcoin find a floor. To understand the underlying logic and possible future trajectories, please read on.
Tether’s Market‑Share Peak Aligns with Bitcoin’s Bottom
As of February, USDT’s share of all dollar‑denominated crypto assets has risen back to 8.50%–9.00% (see the red band in the chart below). This range has repeatedly coincided with Bitcoin’s descent to bear‑market lows throughout history. Historically, when USDT’s dominance climbs, investors tend to shift capital into the low‑risk stablecoin, trimming exposure to more volatile assets such as Bitcoin; conversely, a falling USDT share usually accompanies a flow of funds back into risk‑on assets like Bitcoin.
This inverse relationship was especially pronounced in November 2022: USDT peaked within the 8.50%–9.00% band, while Bitcoin was anchoring a bottom near $15,700 for several months.
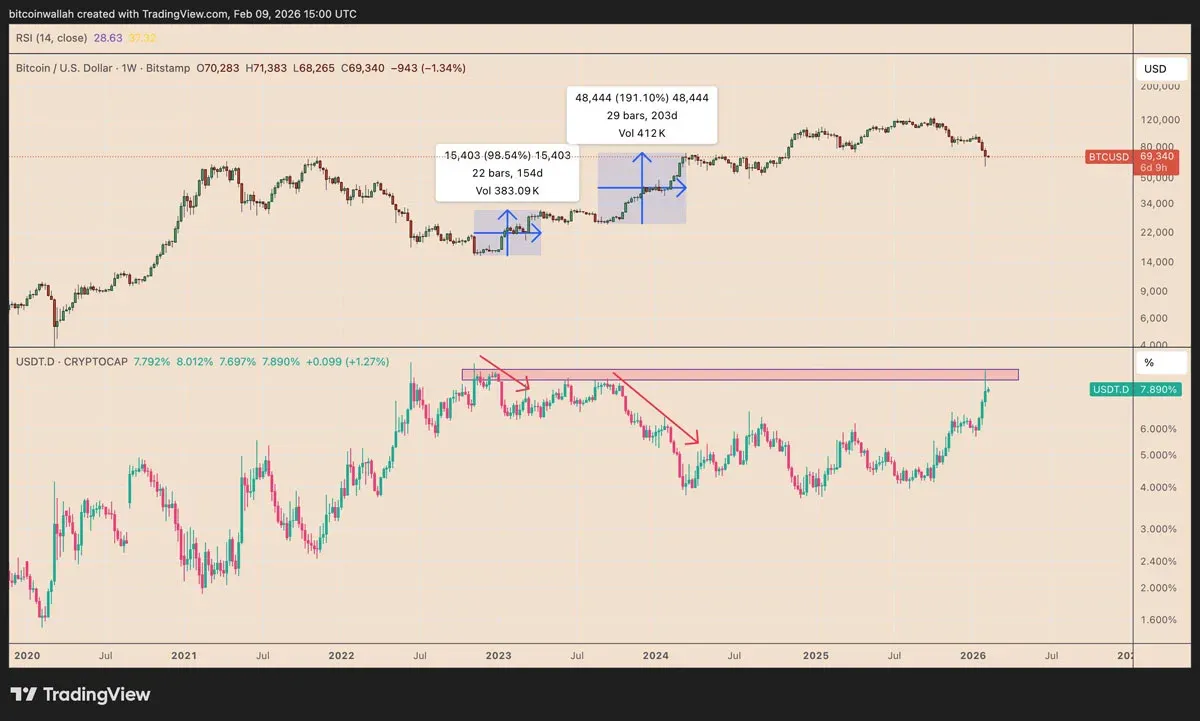
Since then, USDT’s dominance gradually receded, after which Bitcoin surged past $31,000 in March 2024, nearly doubling its value. The 2023–2024 rally again mirrors the same pattern – within a year of USDT hitting a peak, Bitcoin’s price appreciation approached 200%. Consequently, as long as USDT’s market share stays below the 8.50%–9.00% window, the probability of Bitcoin finding a near‑term floor rises.
Fractal Strengthening on Bitcoin’s Chart Supports a Bullish Outlook
On the weekly timeframe, Bitcoin also displays a classic combination of signals that have historically coincided with macro‑level bottoms. In February, the weekly Relative Strength Index (RSI) fell below 30, entering oversold territory, while price rebounded after touching the 200‑week Simple Moving Average (the blue line).
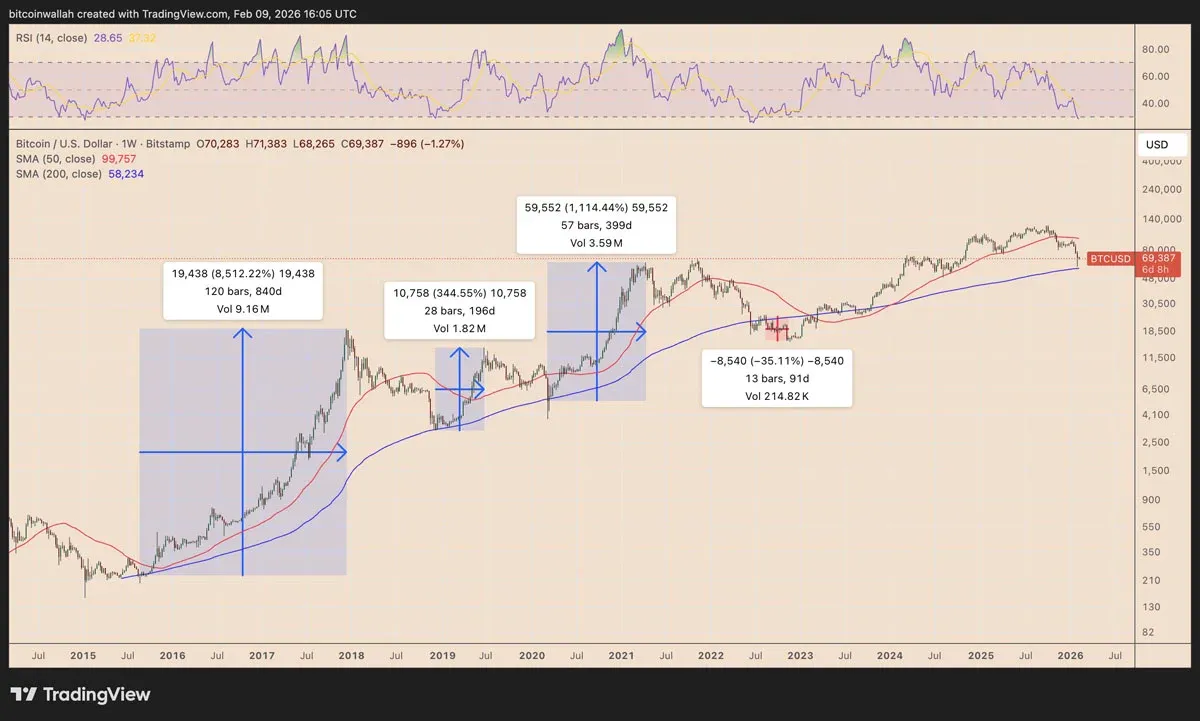
Except for the 2022 episode, this type of formation has consistently foreshadowed gains in the following months. Looking back, Bitcoin rallied roughly 1,115% during 2020‑2021, about 350% in 2018‑2019, and an astounding 8,500% from 2015‑2017. After the start of February, the “bottom‑fishing” sentiment began to appear in actual on‑chain flows: large holders (commonly called “whales”) seized the dip below $60,000, accumulating approximately 40,000 BTC; at the same time, the exchange Binance (U.S. users should use Binance.US) added roughly $300 million worth of Bitcoin to its SAFU insurance fund during the pullback and disclosed a new procurement plan worth $90 million.
In a client‑facing note released on Monday, Bernstein analyst Gautam Chhugani described the current Bitcoin correction as “the weakest phase on record” and reiterated optimism for the long‑term target of $150,000 by the end of 2026.
Bottom Line
The proportion of Tether (USDT) within the dollar‑denominated crypto market is highly correlated with the emergence of a Bitcoin price floor. Monitoring changes in USDT’s share together with Bitcoin’s weekly technical pattern can provide valuable clues on whether Bitcoin will stabilize around the $60,000 mark in the coming weeks. For deeper analysis on the relationship between Tether’s dominance and Bitcoin’s bottom formation, stay tuned to Bitaigen’s future reports.
*Note: Transactions involving fiat currencies are typically processed via USD, SEPA, or SWIFT channels. Additionally, cryptocurrency gains may be subject to tax in many jurisdictions; users should consult local tax regulations.*
Related Reading
- How to Buy Bitcoin on the Dip Safely: Strategies & Risks
- Will Bitcoin Reach $100? Future Price Prediction & Timeline
- BIP-110 Bitcoin Nodes Hit 2.38% Share as Spam War Escalates
💡 Register on Binance with referral code B2345 for the maximum trading fee discount. See Binance complete guide.
⚠️ Risk Disclaimer: Crypto prices are highly volatile. This is not investment advice.


