 Bitaigen Research
Currently Ethereum (ETH) ETF holders are experiencing higher cost pressure and larger drawdowns than Bitcoin (BTC) ETF holders, indicating that the overall market is in a bottom‑building phase.
Spot ETF investors in Bitcoin and Ethereum are bearing significant losses. Although prices are still searching for a local bottom, Bloomberg data show that neither group of investors has chosen to exit. On Thursday, Bitcoin and Ethereum each hit intraday lows of $66,171 and $1,912 respectively, before moving into a price‑search consolidation phase.
As the market evolves, Bloomberg’s latest analysis focuses on the situation of spot ETF holders amid weakening spot Bitcoin prices and slowing ETF inflows.
We approach the issue from the perspective of ETF cost basis and drawdown, dissecting the differing pressure on Ethereum versus Bitcoin funds during the current bottom‑building stage. This helps investors understand capital flows and potential trends. Detailed data and logic will follow in the next sections—worth a careful read. Stay tuned for our in‑depth breakdown.
Key Takeaways
- The net asset value of spot Bitcoin ETFs has fallen from a peak of $170 billion in October 2025 to $85.76 billion, with an estimated net outflow of roughly $2 billion in 2026.
- Spot Ethereum ETF assets have contracted from $30.5 billion to $11.27 billion, with trading prices edging toward $2,000 while the cumulative cost basis sits around $3,500.
- During the most recent decline, only about 6 % of Bitcoin ETF assets were withdrawn, indicating relatively limited selling pressure.
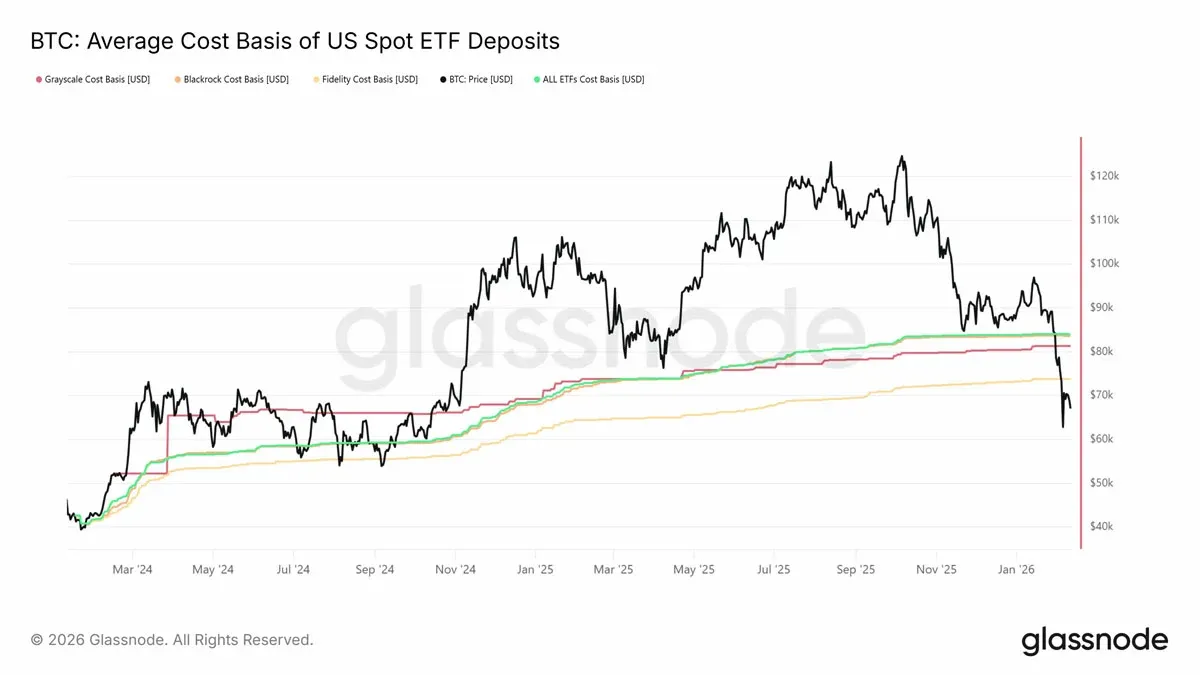
Average cost basis of U.S. spot ETF deposits (source: Glassnode)
Bitcoin, Ethereum ETF Assets Hit by Stagnant Capital Flows
Bloomberg analyst James Seifert said that the pressure on Ethereum ETF holders is “more severe than that on Bitcoin ETF investors.” Ethereum’s price has already slipped below $2,000, far under the roughly $3,500 average cost basis, and the latest low of $1,736 represents a decline of more than 50 %. By contrast, Bitcoin is trading at $66,171—still below the estimated $84,063 cost basis—but the pullback amounts to only about 21 %.
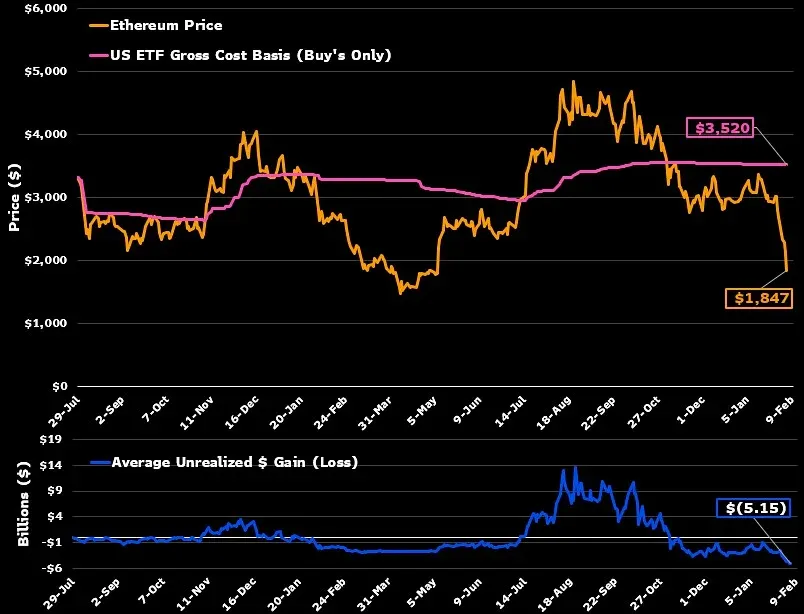
Ethereum ETF cost basis compared with market price (source: James Seifert/X)
Seifert noted that net inflows into Ethereum ETFs have dropped by roughly $3 billion, suggesting that most investors have retained their positions during the recent dip. Bitcoin spot ETF assets peaked at $170 billion in October 2025 and have since declined to $85.76 billion. Since mid‑2025, inflows have markedly slowed: the first half of the year saw a net inflow of $13.7 billion, the second half $7.64 billion, and to date there is an estimated net outflow of about $2 billion. Cumulative net inflows since July 2025 total $5.64 billion.
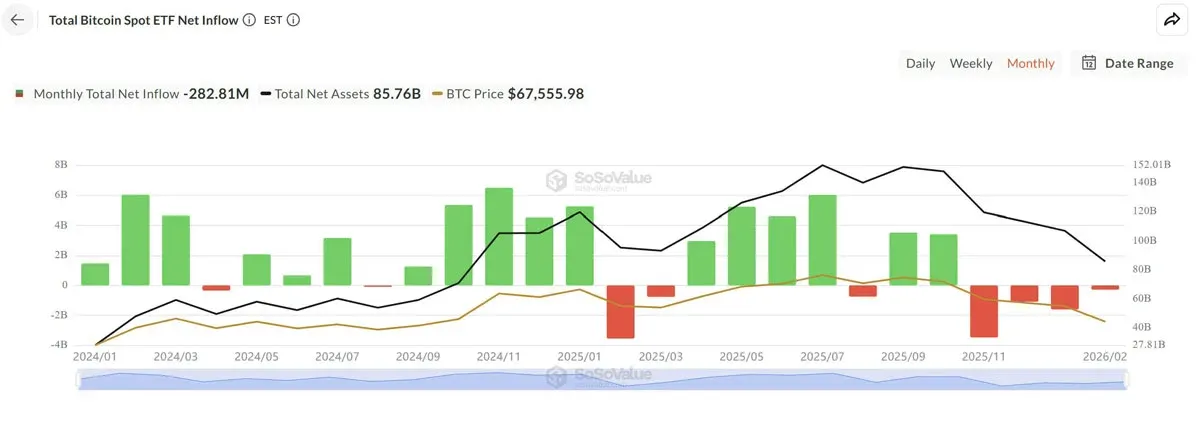
Total net inflow for Bitcoin spot ETFs (source: SoSoValue)
On February 5, Bloomberg senior ETF analyst Eric Barchunas explained that in the recent wave of selling, only about 6 % of Bitcoin ETF total assets were actually withdrawn. BlackRock’s IBIT product has shrunk from a peak of $100 billion to $51 billion, yet it remains one of the fastest‑growing ETFs to breach the $60 billion asset threshold.
Bitcoin ETF Capital Flows Enter Bear‑Market Mode
After failing to restore positive inflows, Bitcoin ETF capital movements over the past 30 days have turned distinctly negative. Apart from a brief rebound, this marks the longest period of continuous outflows since the products were launched.
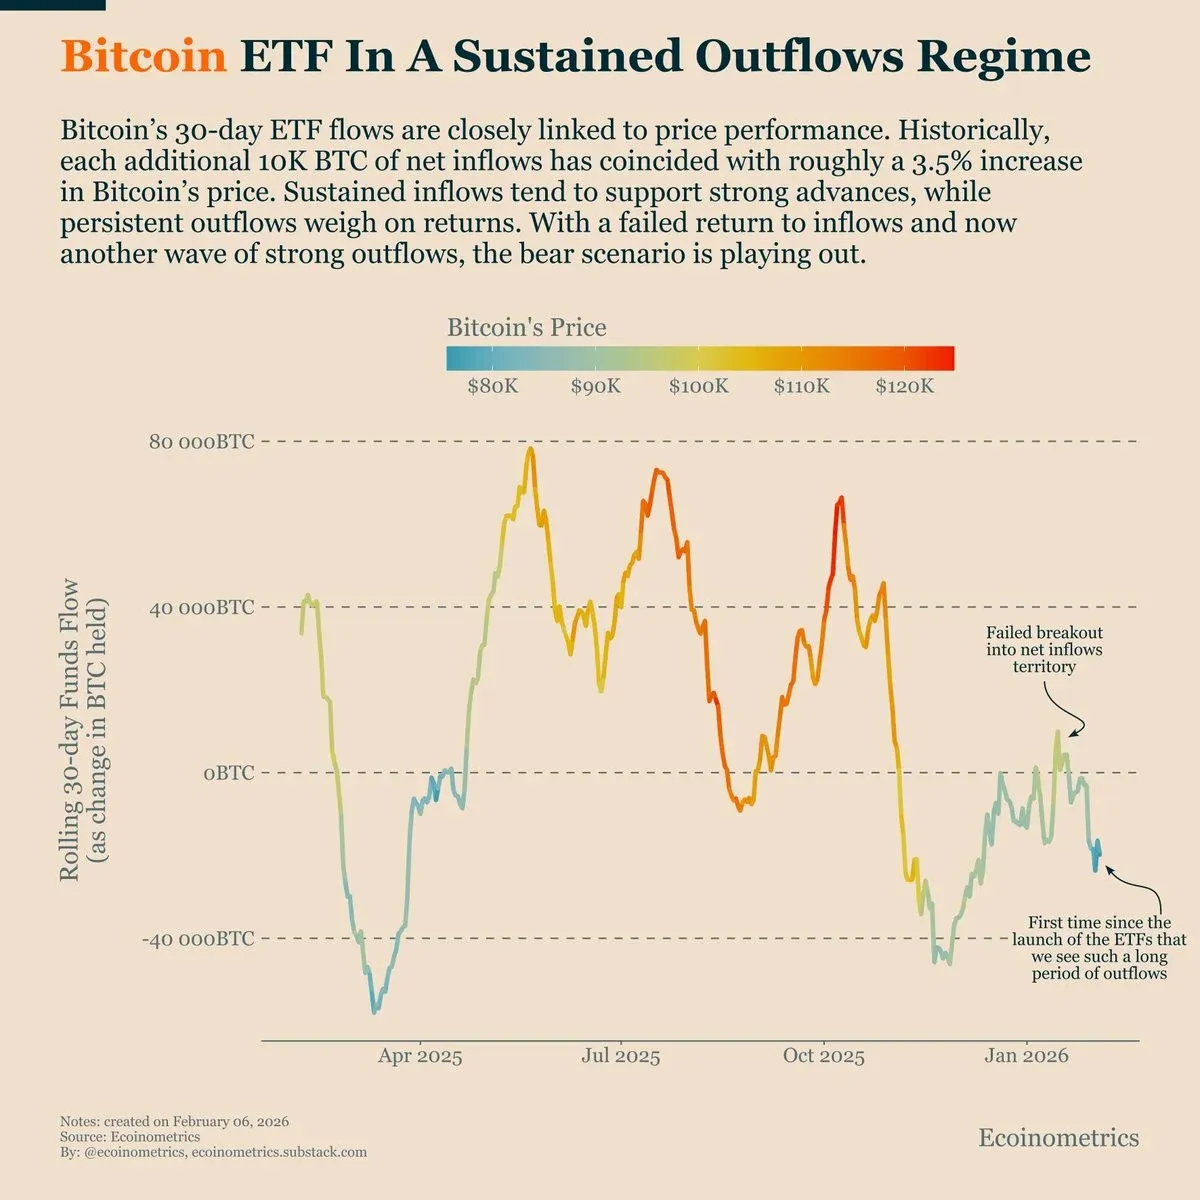
30‑day rolling net fund flow for BTC ETFs (source: ecoinometrics/X)
Glassnode data indicate that over the past 90 days, the 30‑day simple moving average (SMA) net flow for both Bitcoin and Ethereum spot ETFs has...

Related Reading
- Bitcoin ETF Outflows Hit 4th Week as Trump Media Files for ETFs
- How Declining Inflation Shapes Bitcoin Narrative and Price Trends
- U.S. Spot Bitcoin ETF Net Inflow $225M, BlackRock IBIT Leads
💡 Register on Binance with referral code B2345 for the maximum trading fee discount. See Binance complete guide.
⚠️ Risk Disclaimer: Crypto prices are highly volatile. This is not investment advice.



