
We examine Ethereum’s evolution from both technical and macro‑trend perspectives, analysing its long‑term value under core drivers such as decentralized finance (DeFi) and staking. The article provides a panoramic market overview and forward‑looking analysis to help investors decide whether holding or positioning in the coming years makes sense. For key support levels, potential risks and possible appreciation space, keep reading.
Key Takeaways
- Driven by DeFi expansion and blockchain upgrades, Ethereum’s price is expected to rise steadily, potentially approaching USD 10,000 by 2030.
- Leveraging smart contracts, staking rewards and continuous innovation, Ethereum is regarded as a solid long‑term holding candidate.
- By 2026, Ethereum is projected to trade within a USD 1,900‑3,900 range, reflecting improving market trends and adoption rates.
- Ethereum generally follows Bitcoin’s market cycles, but its unique drivers (e.g., staking and DeFi) can add extra performance influence.
Ethereum price forecasts are an important reference for assessing whether the current market is suitable for entry. As the second‑largest crypto asset by market cap, holding Ethereum is equivalent to investing in a network that powers decentralized applications and the broader crypto economy.
This article will walk you through Ethereum’s market snapshot, price history and recent performance. We will apply moving averages and the Relative Strength Index (RSI) for technical analysis, focusing on key support and resistance zones, and present ETH price projections for 2026‑2030. Continue reading for more insight into Ethereum and its long‑term growth potential.
Ethereum (ETH) Overview
Ethereum (ETH) is the second‑largest cryptocurrency by market capitalization, trailing only Bitcoin. It was proposed by Vitalik Buterin in 2013 and launched in 2015. By introducing smart contracts and decentralized applications (dApps), Ethereum fundamentally reshaped blockchain use cases, enabling developers to create on‑chain solutions ranging from digital assets to ERC‑20 tokens.
The network’s native token, ETH, is used to pay transaction fees and reward participants in the ecosystem. The transition to Proof‑of‑Stake (PoS) completed in 2022 enhanced scalability and energy efficiency, laying the groundwork for future development.
Ethereum Market Snapshot
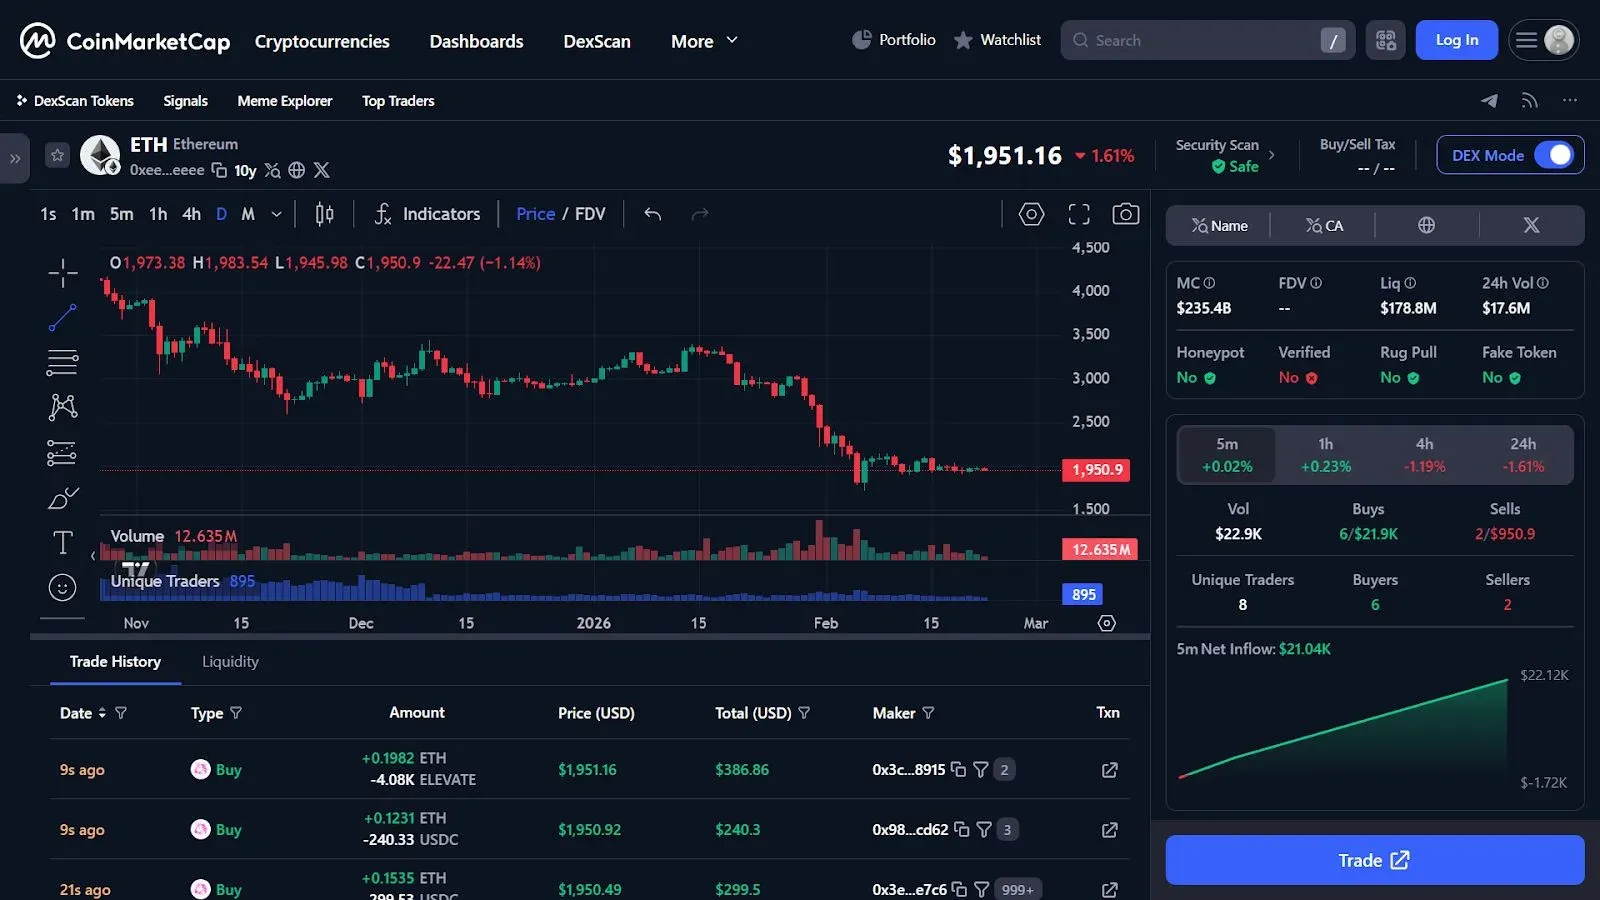
A look at the Ethereum network and its performance within the broader crypto market reveals several highlights. The real‑time ETH‑USD price is currently around USD 1,900, with a market cap exceeding USD 235.25 billion, keeping it among the most valuable digital assets. Price volatility, trading volume and market sentiment can be monitored on the dashboards of major exchanges.
Ethereum is not only a tradable instrument but also a global decentralized blockchain platform that underpins smart contracts and dApps. ETH functions both as a commoditized trading asset and as “fuel” for network activity, spanning DeFi, non‑fungible tokens (NFTs) and Web3 infrastructure.
Within the broader crypto ecosystem, Ethereum’s role is distinctive. Bitcoin often sets overall sentiment and macro trends, whereas Ethereum’s price dynamics more directly reflect network utility and adoption—such as on‑chain transaction volume growth and the rollout of Layer‑2 scaling solutions. Therefore, alongside price charts, understanding the network’s fundamentals is equally important.
ETH Price History and Performance
As of early 2026, ETH has fluctuated between USD 1,900‑3,000, influenced by overall market movements and investor sentiment. Since its launch in 2015, Ethereum has passed several critical milestones; the USD 4,946 all‑time high recorded in August 2025 stands out, driven largely by rapid DeFi expansion and widespread tokenisation of on‑chain assets.
Ethereum’s roadmap is vital for performance upgrades. The 2022 PoS transition reduced energy consumption and boosted scalability. The upcoming Glamsterdam update aims to raise the gas limit and improve Layer‑2 interoperability, further enhancing network efficiency. These advancements are expected to cement Ethereum’s leadership in DeFi and smart‑contract ecosystems.
Ethereum (ETH) Technical Analysis
At present, ETH trades within the USD 1,900‑3,000 band, affected by market sentiment and network development. Key technical indicators such as Moving Averages (MA) and the Relative Strength Index (RSI) help assess trend direction and potential moves.
Moving Averages
ETH’s price sits below the 50‑day moving average (≈ USD 2,100) and the 200‑day moving average (≈ USD 2,300), indicating a downtrend. The short‑term average is falling faster than the long‑term average, suggesting continued selling pressure. A bullish reversal could be signalled if the 50‑day average crosses above the 200‑day average (a “golden cross”).
Relative Strength Index (RSI)
The current RSI is around 48, placing it in a neutral zone. An RSI below 30 would denote oversold conditions, while an RSI above 70 would indicate overbought status and potential correction.
Key Price Levels
- Trading Range: USD 1,900 – 3,000
- Critical Pivot: USD 2,000. Staying above this level supports short‑term stability; a break below could open further downside.
- Immediate Resistance: USD 2,300 – 2,500. Significant volume would be required to achieve a strong breakout and shift market momentum.
Support Levels
| Support | Price (USD) |
|---------|-------------|
| S1 | 1,900 |
| S2 | 1,800 |
| S3 | 1,700 |
| S4 | 1,600 |
| S5 | 1,500 |
Resistance Levels
| Resistance | Price (USD) |
|------------|-------------|
| R1 | 2,300 |
| R2 | 2,500 |
| R3 | 2,700 |
| R4 | 2,900 |
| R5 | 3,000 |
2027 Ethereum Price Forecast
| Month | Low (USD) | Avg (USD) | High (USD) | Expected Return (%) |
|-------|-----------|-----------|------------|----------------------|
| Jan | 2,400 | 3,150 | 3,900 | +95 |
| Feb | 2,410 | 3,160 | 3,910 | +96 |
| Mar | 2,420 | 3,170 | 3,920 | +97 |
| Apr | 2,430 | 3,180 | 3,930 | +98 |
| May | 2,440 | 3,190 | 3,940 | +99 |
| Jun | 2,450 | 3,200 | 3,950 | +100 |
| Jul | 2,460 | 3,210 | 3,960 | +101 |
| Aug | 2,470 | 3,220 | 3,970 | +102 |
| Sep | 2,480 | 3,230 | 3,980 | +103 |
| Oct | 2,490 | 3,240 | 3,990 | +104 |
| Nov | 2,500 | 3,250 | 4,000 | +105 |
| Dec | 2,510 | 3,260 | 4,010 | +106 |
2028 Ethereum Price Forecast
| Month | Low (USD) | Avg (USD) | High (USD) | Expected Return (%) |
|-------|-----------|-----------|------------|----------------------|
| Jan | 2,500 | 3,300 | 4,100 | +110 |
| Feb | 2,510 | 3,310 | 4,110 | +111 |
| Mar | 2,520 | 3,320 | 4,120 | +112 |
| Apr | 2,530 | 3,330 | 4,130 | +113 |
| May | 2,540 | 3,340 | 4,140 | +114 |
| Jun | 2,550 | 3,350 | 4,150 | +115 |
| Jul | 2,560 | 3,360 | 4,160 | +116 |
| Aug | 2,570 | 3,370 | 4,170 | +117 |
| Sep | 2,580 | 3,380 | 4,180 | +118 |
| Oct | 2,590 | 3,390 | 4,190 | +119 |
| Nov | 2,600 | 3,400 | 4,200 | +120 |
| Dec | 2,610 | 3,410 | 4,210 | +121 |
Long‑Term Outlook: 2026‑2030 Ethereum Price Forecast
| Year | Low (USD) | Avg (USD) | High (USD) | Expected Return (%) |
|------|-----------|-----------|------------|----------------------|
| 2026 | 1,900 | 3,100 | 3,900 | +95 |
| 2027 | 2,400 | 3,250 | 4,000 | +105 |
| 2028 | 2,500 | 3,400 | 4,200 | +120 |
| 2029 | 2,600 | 3,550 | 4,400 | +135 |
| 2030 | 2,700 | 3,700 | 4,600 | +150 |
What Factors Can Influence Ethereum’s Price?
Any investor planning a 2026 Ethereum allocation should understand the core drivers behind its value. Ethereum’s price is not solely news‑driven; it reflects a combination of network activity, capital flows, competitive dynamics, and macro‑economic conditions. Major influencing factors include:
1. Network Adoption and Real‑World Utility
Ethereum hosts thousands of dApps, financial protocols and digital‑asset platforms. Every on‑chain interaction consumes ETH, creating ongoing demand that goes beyond pure speculation.
2. Competition from Other Blockchains
Although Ethereum leads the smart‑contract space, it faces competition from chains offering lower fees and faster transaction finality. For example, holding BNB effectively backs an ecosystem focused on cost‑efficiency and scalability. Developer migration to alternative chains could affect short‑term growth.
3. Supply, Staking and Scarcity
Under PoS, validators must lock up ETH to secure the network and earn rewards, reducing the circulating supply of tradable tokens. Additionally, a portion of transaction fees is permanently burned, which over time can exert downward pressure on total supply.
4. Market Cycles and Investor Sentiment
Crypto markets are cyclical. Bitcoin typically leads overall direction, with Ethereum following and often exhibiting larger swings. In bull markets, Ethereum benefits from capital rotation into mainstream alternative assets; in bear markets, it tends to retrace alongside the broader market.
5. Gaming, Web3 Expansion and Institutional Capital
As an early platform for blockchain gaming and tokenised assets, Ethereum continues to drive Web3 infrastructure development. While some projects have migrated to other chains, Ethereum’s extensive use in gaming, tokenised assets and DeFi sustains network activity and reinforces demand for ETH.
Key Risks That Could Impact Ethereum Forecasts
Every price projection must be paired with an assessment of downside risks. Although Ethereum’s fundamentals are solid, the inherent uncertainty of the crypto sector warrants attention. Principal risks include:
- Regulatory Uncertainty – Policy shifts could affect staking, exchange operations or DeFi platforms. Strict regulation or ambiguous guidance may reduce liquidity or slow institutional participation, leading to short‑term volatility.
- Network Congestion and High Gas Fees – Surges in on‑chain activity can raise transaction costs, prompting users and developers to seek cheaper alternatives. Layer‑2 solutions alleviate pressure, but they must be continuously implemented to preserve competitiveness.
- Macro‑Economic and Market Volatility – Crypto assets are highly sensitive to global liquidity, interest‑rate changes and risk appetite. Economic tightening or financial turmoil can trigger large‑scale sell‑offs, causing ETH to move in tandem with the broader market.
- Security and Contract Vulnerabilities – While the core protocol is relatively secure, dApps built on Ethereum may still suffer hacks or code flaws. Major security incidents could erode ecosystem confidence and exert a negative short‑term price impact.
Final Thoughts
Ethereum remains one of the most pivotal assets in the crypto market. Its network continuously fuels innovation in DeFi, digital assets and Web3, giving ETH a utility component that goes beyond pure speculation. Long‑term price direction will depend on adoption rates, supply dynamics, competitive landscape, regulatory environment and overall market cycles. When deciding whether to buy in 2026 or hold over the longer term, focus on fundamentals rather than short‑term hype. Rigorous research and realistic expectations are always more valuable than price fluctuations alone.
Note for U.S. readers: Access to Ethereum on the global Binance platform is unavailable in the United States; you should use Binance.US or other compliant U.S. exchanges.
Fiat transactions: When converting between crypto and fiat, you may use USD via SEPA, SWIFT or local bank transfers, depending on your jurisdiction.
Tax reminder: Crypto gains may be taxable in your local jurisdiction; consult a tax professional for advice.
Frequently Asked Questions
Will Ethereum reach USD 10,000 by 2030?
Reaching USD 10,000 in 2030 is not guaranteed; it depends on adoption, DeFi growth and the overall market environment. The figure is purely speculative.
Is Ethereum a good long‑term investment?
Because of its leading position in DeFi, smart contracts and ongoing blockchain upgrades, Ethereum is often regarded as an asset with long‑term value potential.
What value is Ethereum expected to have by 2026?
Based on current trends and the roadmap, ETH is projected to fluctuate between USD 1,900‑3,900 in 2026.
Is staking Ethereum profitable?
Staking ETH yields network‑security rewards; the exact return depends on the amount staked and overall network activity.
Does Ethereum follow Bitcoin’s market cycle?
Yes. Ethereum’s market cycle typically mirrors Bitcoin’s movements, though unique factors such as DeFi and staking can provide additional drivers.
---
*End of article. For more Ethereum analysis, search for Bitaigen (比特根) archives or continue browsing related content below. Thank you for following and supporting Bitaigen!*
💡 Register on Binance with referral code B2345 for the maximum trading fee discount. See Binance complete guide.
⚠️ Risk Disclaimer: Crypto prices are highly volatile. This is not investment advice.


