
After a strong breakout in July, HBAR has once again captured market attention. The technical outlook is heavily bullish, and the price has retaken a key support level, indicating the potential to enter a new upward cycle that could significantly influence its trajectory through 2030.
We conduct an in‑depth analysis of HBAR from three angles—technicals, capital flows, and ecosystem development—to assess its trend potential over the coming years. The article unpacks the logic behind the recent key breakout, combines it with the competitive landscape, and offers a medium‑ to long‑term perspective for readers to consider potential opportunities.
Hedera (HBAR) Price Analysis (Signals and Indicators)
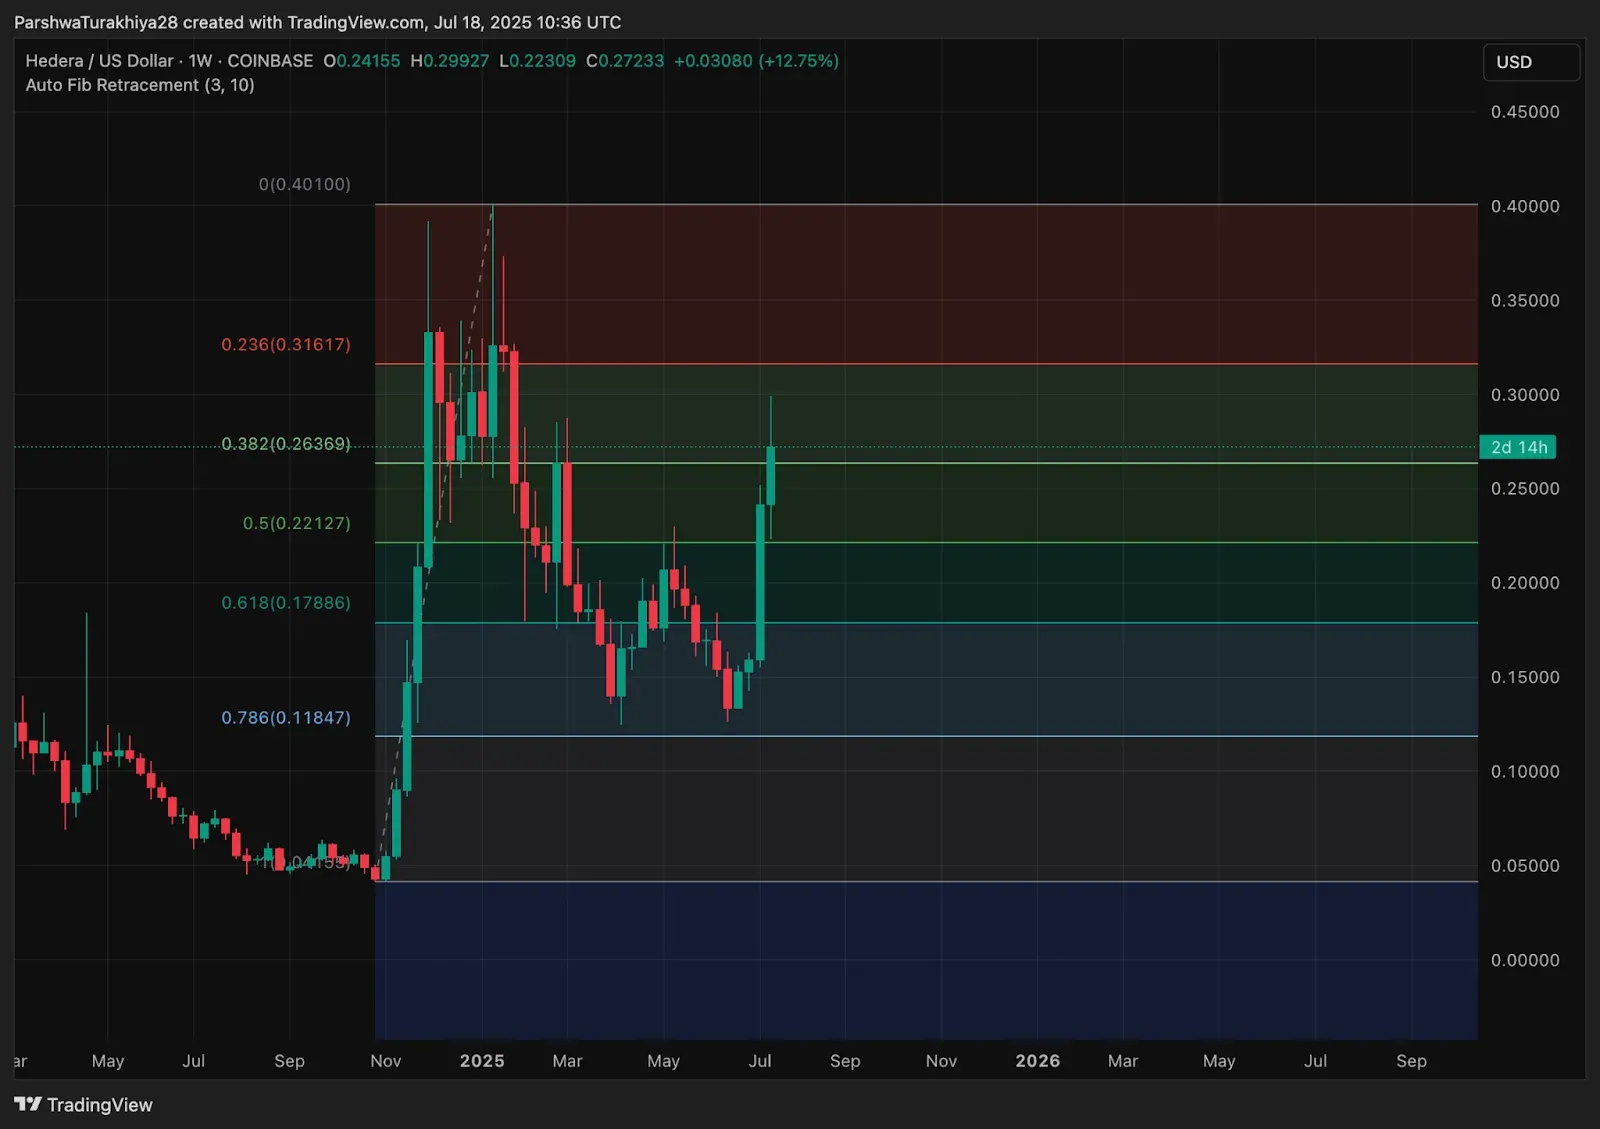
HBAR’s chart across multiple timeframes has turned bullish. After roughly six months of sideways consolidation, the July breakout successfully reclaimed the 0.5 ( $0.221 ) and 0.382 ( $0.263 ) Fibonacci zones, and momentum has accelerated noticeably.
On the daily chart, the RSI is edging toward the over‑bought region, suggesting a possible short‑term correction with a target range around $0.24‑$0.25. Nevertheless, the price remains above the EMA cluster, and the widening volatility band hints that the uptrend is still intact. If the weekly closing price stays above $0.263, the subsequent Fibonacci targets would sequentially point to $0.316 (0.236 USD) and the prior high of $0.40. The daily structure confirms a V‑shaped recovery, with strong buying support forming in the $0.18‑$0.20 zone.
What Is Hedera (HBAR)?
Hedera is a public, decentralized network that focuses on delivering a high‑speed, secure, and highly scalable environment for applications. Unlike traditional blockchains such as Bitcoin or Ethereum, Hedera utilizes Hashgraph technology—a Directed Acyclic Graph (DAG) architecture—that enables transactions to reach finality within seconds, costs roughly $0.0001 per transaction, and consumes a fraction of the energy used by mainstream chains.
HBAR, the native token of the Hedera network, is used to pay transaction fees, smart‑contract execution costs, and to stake for network security. Governance is handled by a council of up to 39 global institutions, including heavyweight firms like Google, IBM, Boeing, and Deutsche Telekom. The council oversees software upgrades and long‑term stability, giving Hedera a distinctive appeal for enterprise‑grade scalability solutions. The platform’s use cases span tokenization, supply‑chain provenance, central‑bank digital currency (CBDC) pilots, and AI workload verification, aiming to create a compliance‑friendly ecosystem geared toward mainstream adoption.
HBAR Token Economics
HBAR funds network security, node operation costs, and dApp “fuel.” The total supply cap is 500 billion tokens, of which roughly 422 billion are already circulating; release follows a 15‑year schedule designed to mitigate sudden sell‑off risk.
- Circulating supply: 42.24 B HBAR
- Maximum supply: 50 B HBAR
- Annualized staking yield (liquid): about 5 % APY (via Stader)
- Approximately 30 % of the supply is currently staked
The continuously decreasing issuance, combined with a staking rate near one‑third, provides a foundation for long‑term price stability.
Hedera (HBAR) 2025 Price Forecast
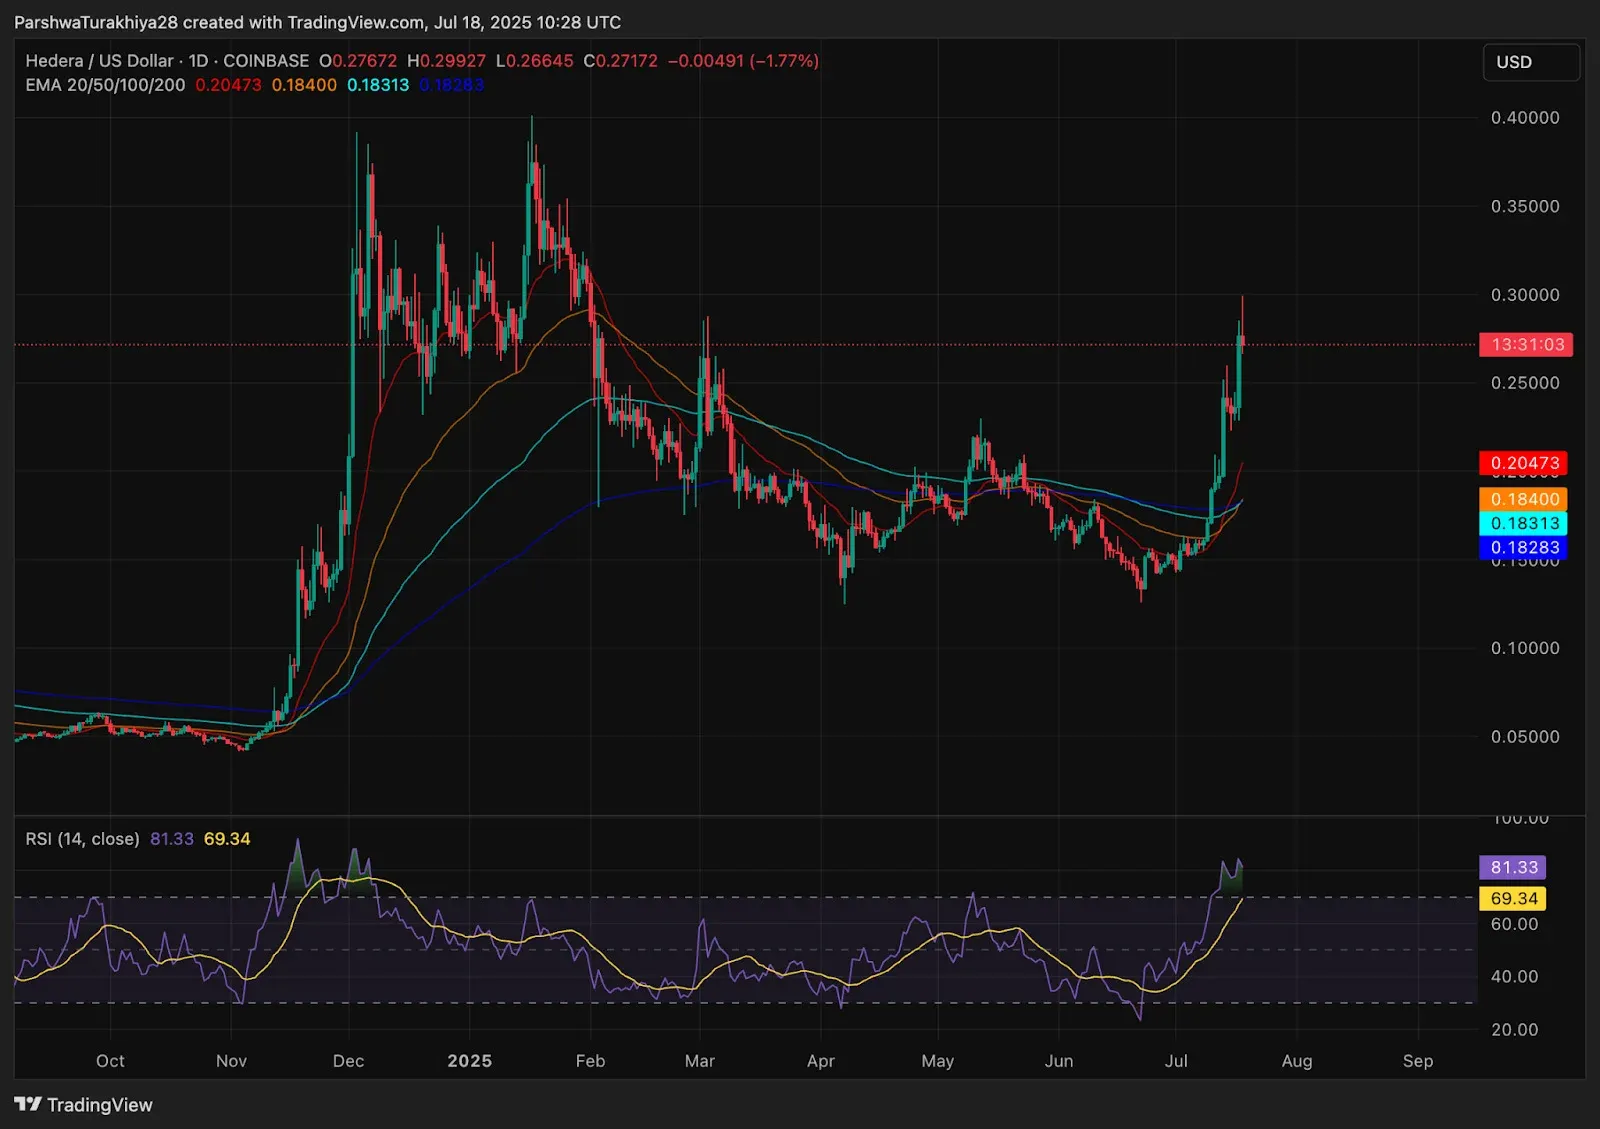
HBAR is trading around $0.27, a rebound from the sub‑$0.16 trough it hit mid‑year. On the weekly chart, the price has retaken the 0.382 Fibonacci retracement level ( $0.263 ) and has broken through a key resistance, ending months of lateral movement. The daily RSI sits at 81, indicating strong upward momentum, though a short‑term pullback remains possible. The Keltner Channel shows HBAR approaching its upper band, suggesting volatility could expand further.
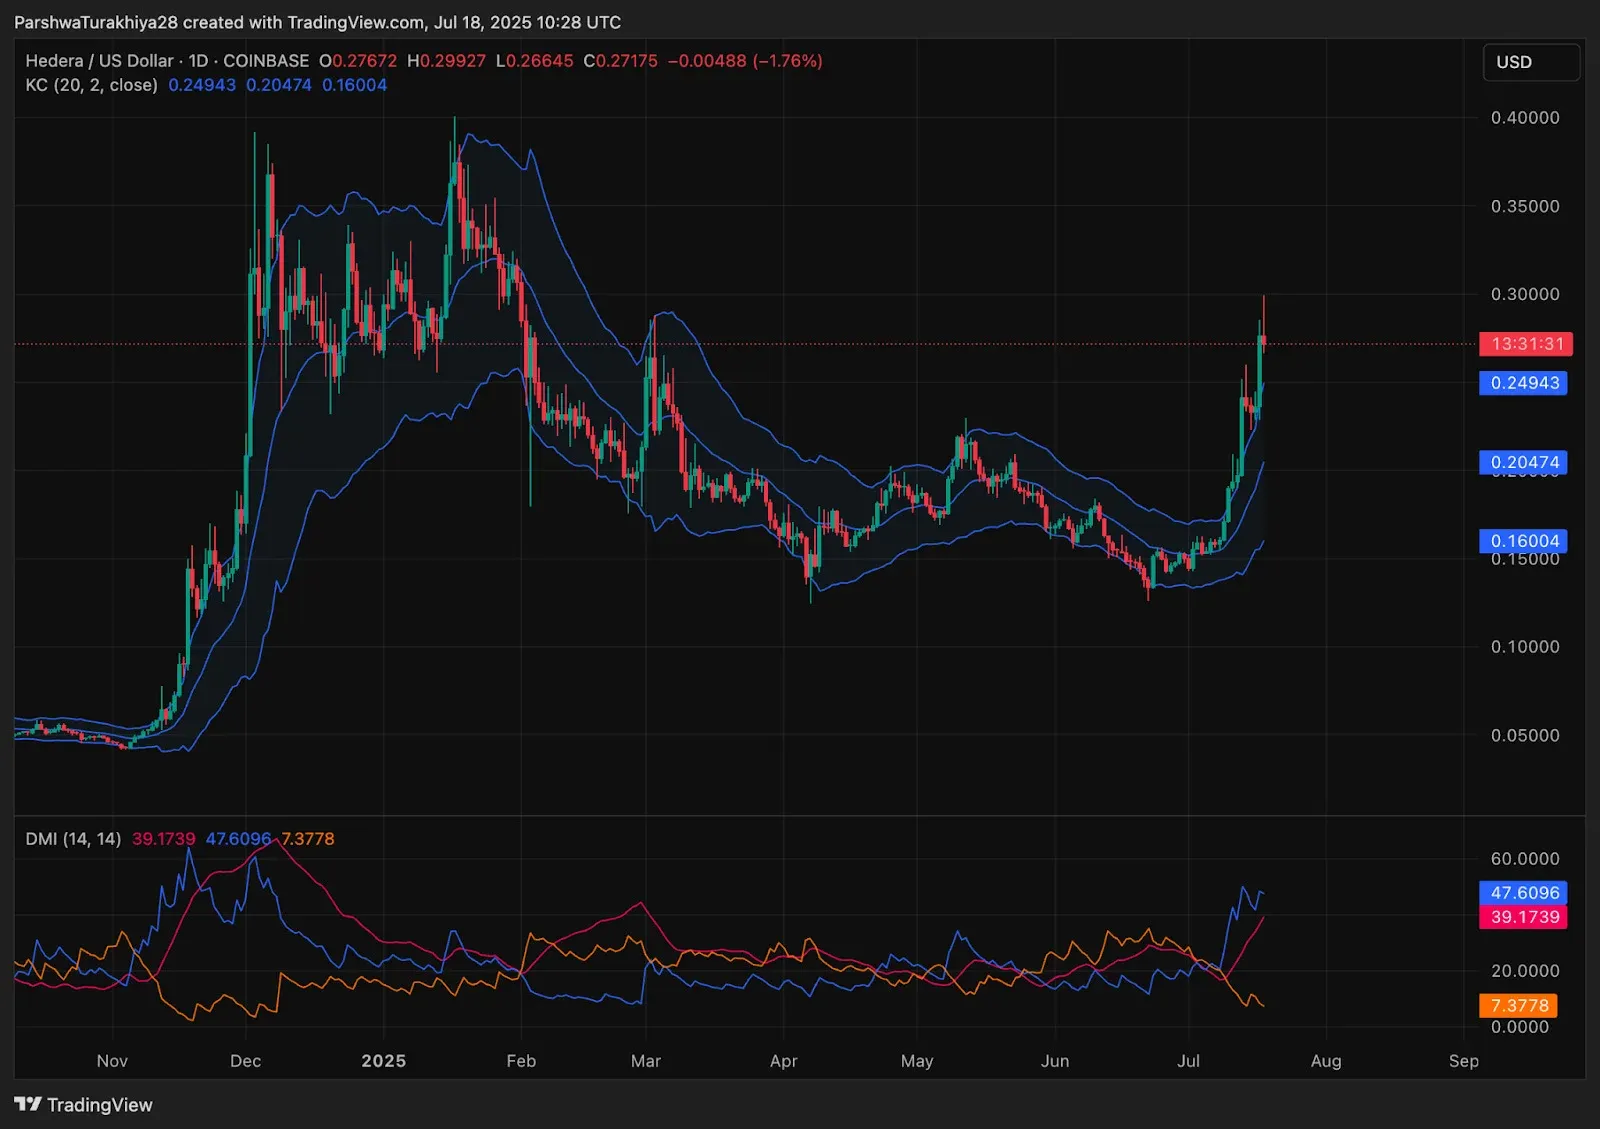
Short‑term moving averages continue to align with the bullish trend. Both the 20‑day EMA ( $0.204 ) and the 50‑day EMA ( $0.184 ) are sloping upward, and the price stays comfortably above all major averages. The DMI indicator shows the +DI breaking above 47, signaling buyer dominance, while the –DI has fallen to roughly 7, reinforcing the bullish sentiment. Should the price hold above the $0.25‑$0.26 band, the target range for the end of 2025 could shift upward to $0.32‑$0.38.
Hedera (HBAR) 2025‑2030 Price Targets
Year | Potential Low ($) | Potential Mid ($) | Potential High ($)
--- | --- | --- | ---
2025 | 0.18 | 0.28 | 0.40
2026 | 0.24 | 0.35 | 0.52
2027 | 0.30 | 0.47 | 0.68
2028 | 0.38 | 0.62 | 0.85
2029 | 0.44 | 0.74 | 1.05
2030 | 0.52 | 0.88 | 1.25
Hedera (HBAR) 2026 Price Forecast
With accelerating developer activity and expanding institutional partnerships, the breakout structure is expected to mature further in 2026. If the price can firmly anchor above $0.30, the next expansion phase may push it into the $0.50‑$0.52 corridor. Provided macro conditions remain relatively stable, a robust base around $0.24 is likely to hold.
Hedera (HBAR) 2027 Price Forecast
Entering 2027, long‑term moving averages are anticipated to follow the price upward, creating a gradual yet sustained uptrend. If bullish sentiment continues to ferment, HBAR could challenge $0.68, especially under the continued push from the council and eco‑friendly network initiatives. Breaking above $0.47 would serve as a key confirmation for further strength.
Hedera (HBAR) 2028 Price Forecast
By 2028, the broader alt‑coin cycle may enter an upward phase, providing momentum for HBAR to breach the $0.85 level. Institutional inflows, widespread enterprise dApp adoption, and overall ecosystem upgrades are expected to be the primary drivers. Unless a significant macro shock occurs, downside moves are projected to be limited to a shallow range near $0.38.
Hedera (HBAR) 2029 Price Forecast
If Hedera maintains its first‑layer competitive edge and scales effectively, 2029 could see a price discovery phase around $1.05. Technical patterns may echo earlier upward formations, with a mid‑year correction likely in the $0.60‑$0.65 band before new highs are set.
Hedera (HBAR) 2030 Price Forecast
Looking toward 2030, HBAR is poised to become one of the most widely used base layers in government and enterprise contexts. The upper bound could approach $1.25, while the average level may settle around $0.88. Ongoing technological innovation, network expansion, and sustained market share in the first‑layer space are the critical pillars for achieving this range.
Conclusion
Since the end of 2023, HBAR has built the strongest bullish structure seen since the previous year’s end. The price has reclaimed key retracement levels, and momentum indicators collectively confirm a vigorous uptrend, suggesting the asset is entering a multi‑year growth window. The $0.18‑$0.20 support zone remains a critical defensive line; a breakthrough above $0.32 could herald the start of a new high series. If the July breakout holds, both traders and long‑term holders may find relatively favorable risk‑reward opportunities.
*Please note that cryptocurrency gains may be taxable under the laws of your local jurisdiction.*
*U.S. readers should conduct trades on Binance.US rather than the global Binance platform.*
For further in‑depth analysis of Hedera (HBAR)’s future trajectory, you can consult previous Bitaigen (比特根) articles or continue reading the related links below. Thank you for following and supporting Bitaigen (比特根)!
💡 Register on Binance with referral code B2345 for the maximum trading fee discount. See Binance complete guide.
⚠️ Risk Disclaimer: Crypto prices are highly volatile. This is not investment advice.


