
In this article we outline the recent key price points for Pi, analyze the potential liquidity boost from the upcoming Kraken listing, and assess how the imminent token unlocks could affect the supply‑demand balance. By combining multi‑dimensional data and market dynamics, we aim to help readers spot recovery signals—worth a careful read.
- Pi’s price is testing a critical breakout level at $0.22, but the overall downtrend still dominates.
- Approximately 161 million Pi are slated to unlock over the next 30 days, which could exert upward pressure on supply during a recovery phase.
- The Kraken listing is expected to improve liquidity and may alter Pi’s short‑term demand dynamics.

Exchange Listings Bring Fresh Momentum
Kraken plans to launch Pi token trading on March 14, providing a new entry point for U.S. investors (U.S. users should use Binance.US rather than the global Binance platform). In addition to OKX, several global exchanges—including MEXC, BitGet, and Gate.io—have already added Pi. The expansion of trading venues is likely to increase liquidity and attract more retail participants.

Potential Impact of Token Unlocks on Supply‑Demand
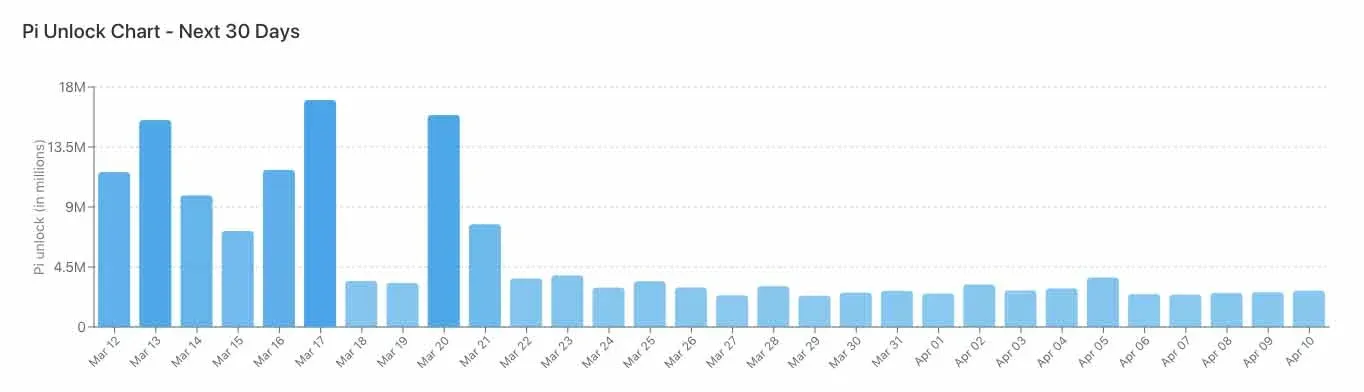
On‑chain data shows that more than 5.7 billion Pi remain locked in the network. Over the next 30 days an estimated 161 million Pi (about 2.82 % of the locked total) are expected to be released. The average daily unlock volume is roughly 5.37 million Pi, with a potential peak on March 17 where over 17 million Pi could enter circulation in a single day. This supply influx is likely to have a direct effect on short‑term price volatility.
Technical Overview: Short‑Term Bounce Intertwined with Long‑Term Downtrend
Pi is currently trading within a $0.20‑$0.24 range, reflecting cautious optimism after a recent low‑point rebound. Since June, the price has been moving down a descending channel, repeatedly setting new lows. However, buying interest has re‑entered the historic support zone of $0.13‑$0.14, lifting the price back above $0.22.
From an indicator perspective, Pi has reclaimed the 20‑day exponential moving average (EMA), suggesting a revival of short‑term momentum. Yet it remains below both the 100‑day and 200‑day moving averages, indicating a bearish medium‑ to long‑term bias. The upper Bollinger Band has been touched, hinting at possible consolidation or a temporary pull‑back, while a short‑term downtrend line was broken, signaling weakening selling pressure.
Key Levels and Possible Market Scenarios
- Support zone: The strongest support lies between $0.13 and $0.14; a break below could reignite the broader downtrend. A secondary support exists around $0.19‑$0.20.
- Short‑term breakout point: $0.22 functions as the current pivotal upper support—holding it may allow a move upward.
- Resistance tiers: Immediate resistance is clustered at $0.24‑$0.25, aligning with the Bollinger upper band and recent highs. The first major technical barrier is at $0.28; a clear break could trigger the first substantive trend reversal. Higher resistances sit near $0.33 and $0.37, zones historically prone to strong sell‑offs.
Price Outlook and Potential Trajectories
Upside target: Should the price breach $0.28, further advances toward $0.33, $0.37, and even the $0.44 region become plausible.
Downside risk: $0.22 is the primary support; a breach could initiate a first pull‑back to $0.20, with further deterioration possibly reaching $0.17 and a final floor around $0.13.
Overall Assessment: Can Pi Sustain Its Recovery Momentum?
Technically, Pi has reclaimed short‑term moving averages and broken a modest downtrend line, yet it remains under the longer‑term averages, keeping the macro trend bearish. If the $0.22 level holds, a short‑term rebound toward $0.28‑$0.33 appears feasible; otherwise, the probability of a slide back to $0.20 or lower increases.
Both the upcoming token unlocks and Kraken’s listing will inject fresh variables into the market. The supply surge expected around the unlock peak (approximately March 17) could heighten volatility, while the addition of Pi on a major U.S.‑focused exchange may draw additional retail demand, further influencing price direction.
The above constitutes the full analysis titled “Pi price forecast: Kraken listing draws market attention, Pi may rebound.” For deeper Pi‑price insights, you can search the Bitaigen (比特根) archive or continue with the recommended reads below. Thank you for supporting Bitaigen!
*Note: Crypto gains may be taxable in your jurisdiction. When converting fiat, consider using USD, SEPA, or SWIFT transfers as appropriate for your region.*
💡 Register on Binance with referral code B2345 for the maximum trading fee discount. See Binance complete guide.


