
Silver’s recent performance has drawn considerable attention, but before diving into the underlying drivers, let’s give readers a comprehensive overview: from supply‑demand imbalances to speculative fervor, and from technical indicators that have deviated sharply, multiple forces are jointly propelling this precious metal to unprecedented heights.
We examine silver’s recent anomalous moves from three perspectives—supply‑demand, speculation, and technicals—to help investors understand the drivers and to highlight practical risk‑identification points. Through ten intuitive charts, this article dissects the market logic layer by layer and is worth a careful read.
Realised Volatility Has Soared
As silver prices keep climbing, intraday price swings have widened in tandem. The 30‑day realised volatility is now approaching one of its historic peaks, signalling a market characterised by sharp fluctuations.
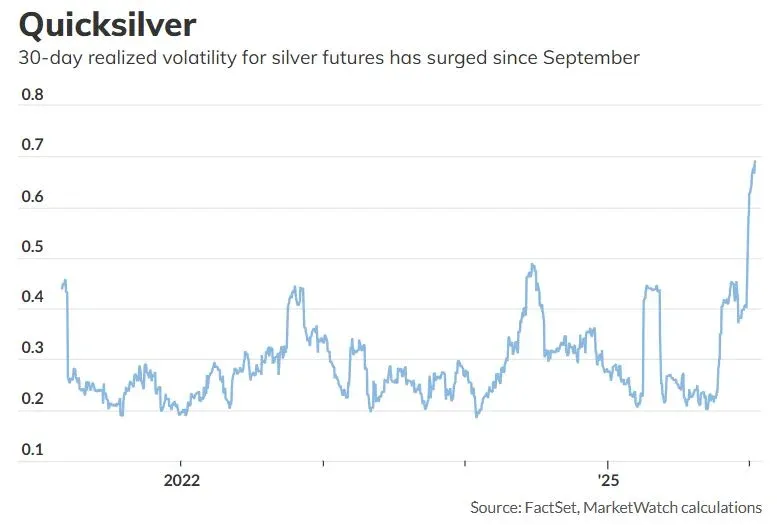
According to FactSet, silver futures in March fell more than 4 % on last Friday, marking the seventh single‑day move of ≥ 4 % since the start of 2026.
Futures Curve Shows Spot Premium
Rapid growth in physical‑silver demand has created a price dislocation between the spot market and futures contracts. On last Friday, the spot price quoted by the London Metal Exchange was slightly higher than the futures contract that expires in the same month.
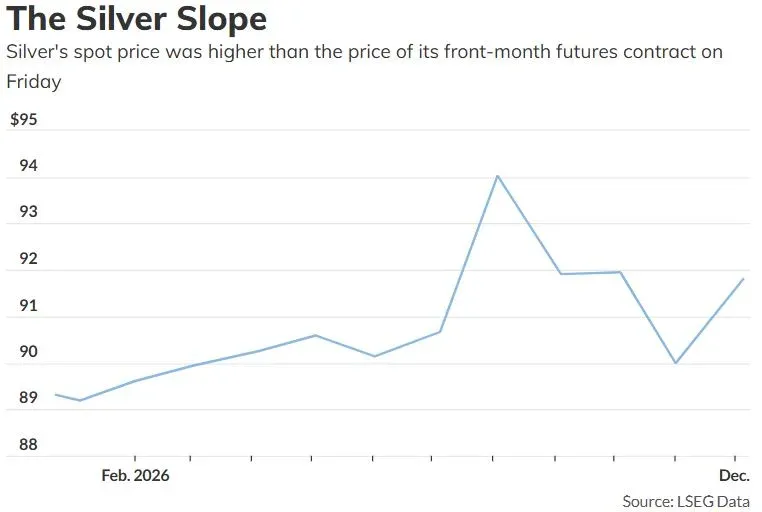
In commodities, a spot price higher than the corresponding futures price is known as a “spot premium.” HSBC Securities’ chief precious‑metals analyst James Steele explains that this reflects a clearly tightening market.
Trans‑Atlantic Relocation
Since the beginning of last year, large quantities of physical silver have been moved from the London vaults to New York vaults, creating a pronounced shift in supply flows. The chart below illustrates the direct impact of this migration on New York inventories.
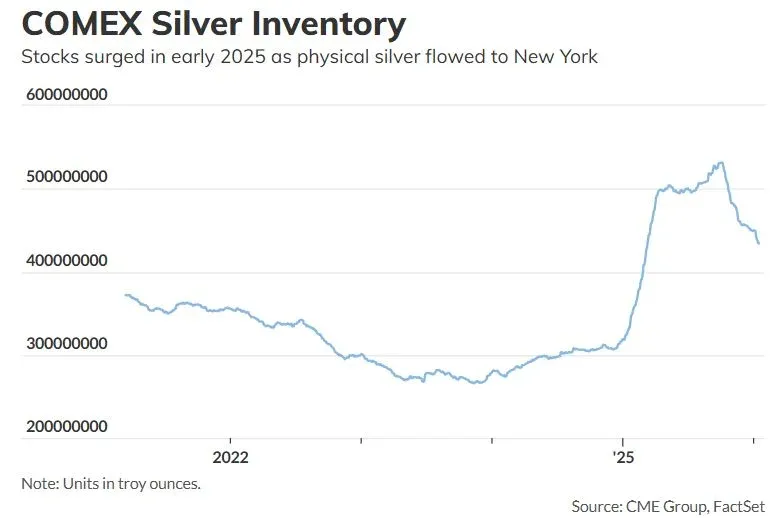
Data from the London Bullion Market Association also show silver flowing out of the region. Steele notes that, although tariff measures were ultimately not implemented, the anticipation of them has already triggered a transfer of several hundred million dollars’ worth of silver to New York, tightening physical inventories and forcing buyers to pay a premium for metal on hand.
Gold‑to‑Silver Ratio Hits Lowest Since 2011
In the precious‑metals arena, a rise in gold often pulls silver upward afterward. Recent market behaviour mirrors this pattern: when gold climbs, some investors ask whether it is time to buy silver to capture a potential lagged gain.
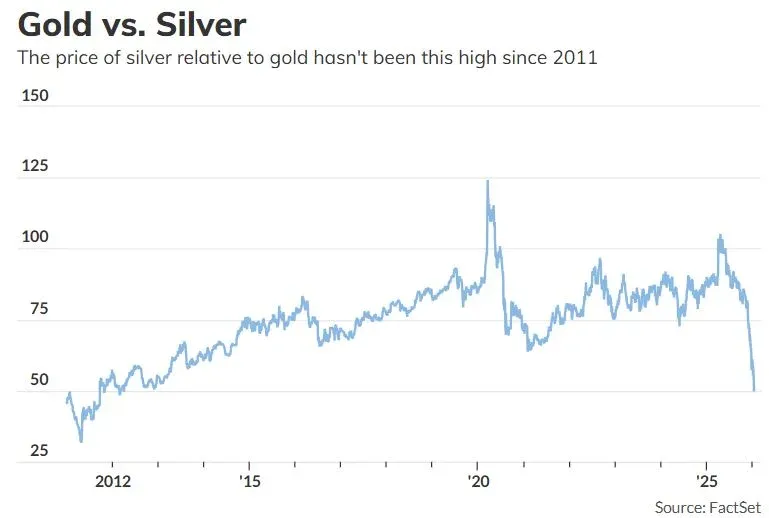
The figure shows that over the past year silver’s value relative to gold has shifted from being extremely cheap to relatively expensive, a change partly attributed to speculative inflows driven by “fear of missing out” (FOMO).
Retail Inflows Into Silver ETFs
A recent Vanda Research report indicates that retail interest in silver has surged over roughly the past month, with cumulative inflows of $921.8 million over a 30‑day window—a historic high.
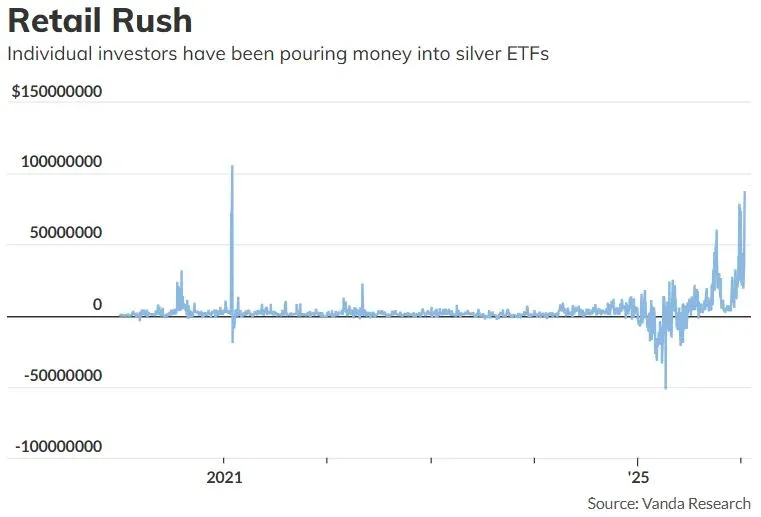
The money has mainly flowed into the ProShares Ultra Silver ETF, Sprott Physical Silver Trust, and iShares Silver Trust, the latter giving investors exposure to either physical silver or futures positions. Even though the ProShares UltraShort Silver ETF has lost more than 90 % over the past year, its inflows have begun to recover.
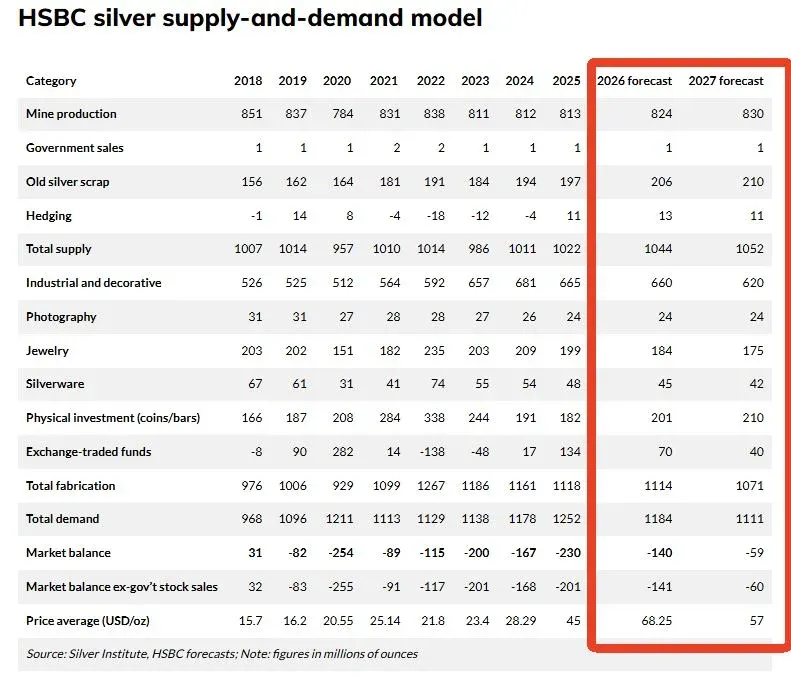
Supply‑Demand Balance
HSBC’s Steele points out that the 2025 silver market is experiencing a pronounced supply‑demand imbalance, with the Silver Institute estimating a global shortfall of roughly 230 million ounces. As prices rise, industrial users will be forced to conserve usage, while demand for silver jewelry is also expected to weaken. The gap is projected to gradually narrow during 2026‑2027.
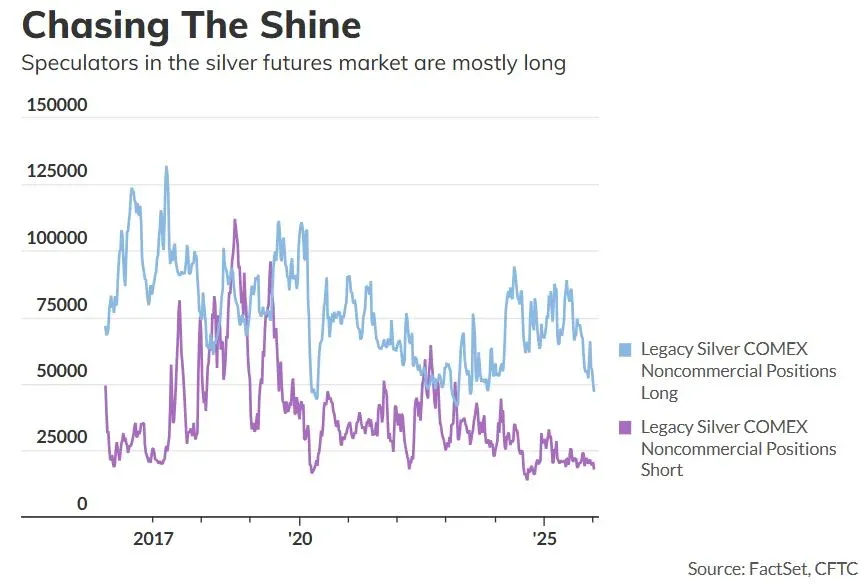
Futures Traders Are Net Long
Weekly position data released by the U.S. Commodity Futures Trading Commission (CFTC) show that the overwhelming majority of speculators in the futures market continue to hold long positions. At the same time, Steele emphasizes that short positions remain insufficient, further confirming a dominant bullish sentiment.
Options Traders Betting on a Big Rise
Bob Haberkoen, a strategist at RJO Futures, notes a marked increase in the open‑interest of silver options, especially contracts with out‑of‑the‑money strike prices.
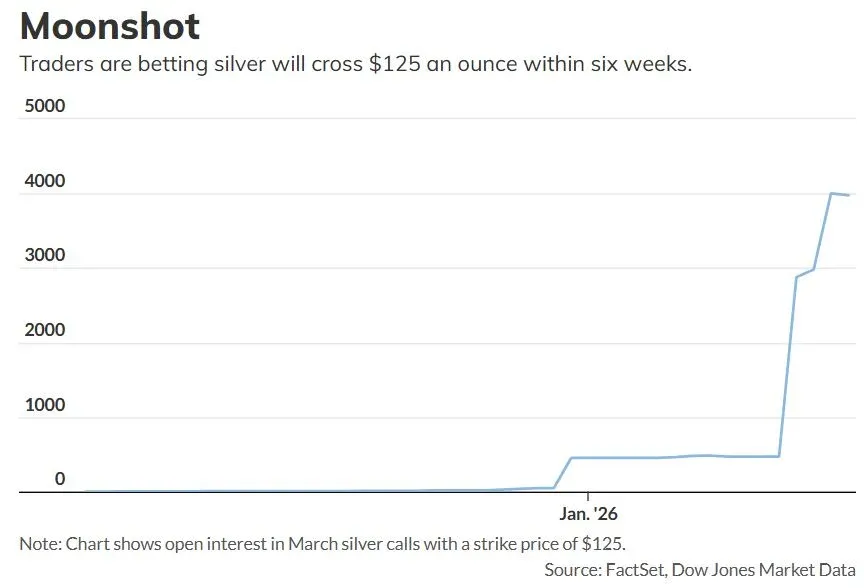
Each contract represents 5,000 ounces of silver; based on last Friday’s market price, the nominal value of these contracts exceeds $182 million. While this does not guarantee that prices will breach $125 per ounce before April, extremely bullish speculation often precedes short‑term pullbacks.
Moving Averages
Silver futures have recently traded far above several key technical benchmarks. Last week, the price was 46.7 % above the 50‑day moving average—the last time this occurred was April 1987, a period marked by a weakening dollar, rising inflation, and heightened Middle‑East tensions.
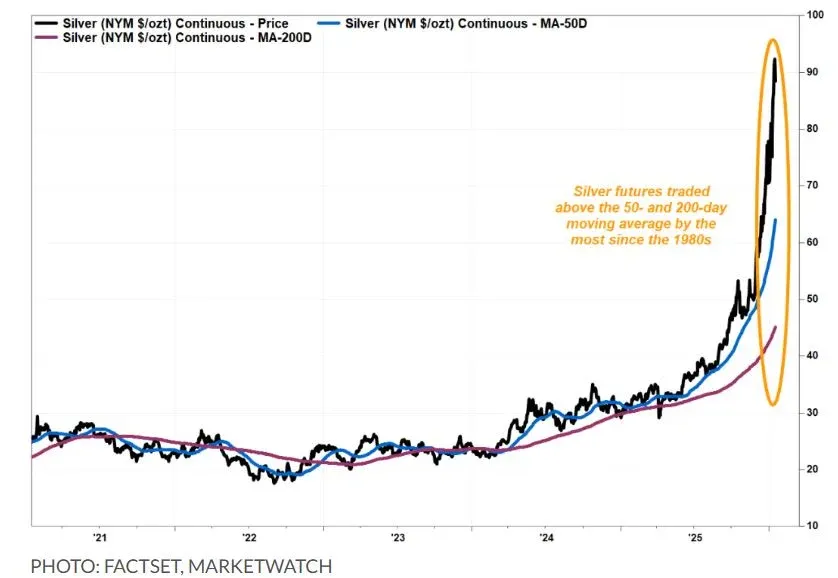
Likewise, futures are 105.9 % above the 200‑day moving average, a situation previously seen in January‑February 1980, when the Hunt brothers were attempting to manipulate the silver market.
Will the 2026 Upswing Accelerate?
Since January 1, silver’s price has risen more than 25 % cumulatively. Some Wall Street commentators believe silver could soon break the $100 per ounce barrier for the first time.
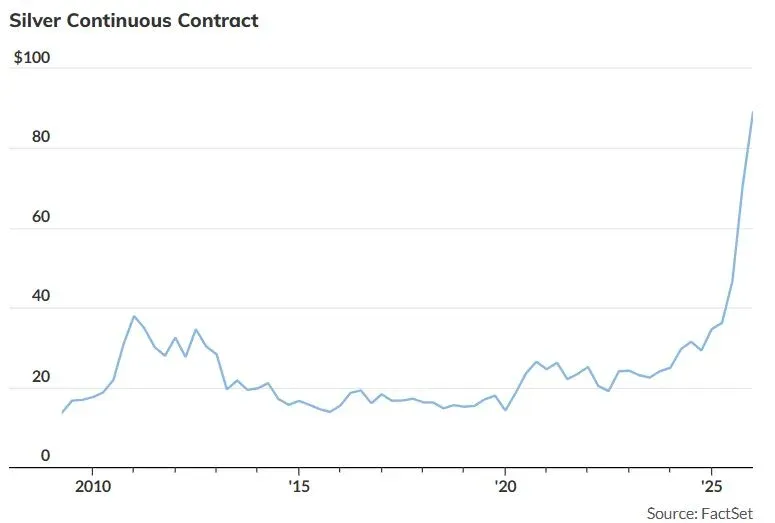
Silver Is Currently Red‑Hot
Dow Jones market data show that the strong momentum that began in December 2023 has turned into a parabolic, rapid rally. The most actively traded futures contract posted a > 24 % gain for the month—the largest single‑month rise since July 2020—and set the stage for a > 140 % annual gain in 2025, making it the best‑performing year on record.
---
Through ten key charts, the material systematically outlines silver’s historic rally and the forces behind it, helping investors obtain a full picture of the current market landscape. For deeper analysis of silver market dynamics, stay tuned to Bitaigen’s forthcoming reports.
Related Reading
- Ethereum $2,000 Resistance Holds: March Outlook & Pull‑Back Scenarios
- TradingView 30-Minute Tutorial: Setup & Execution 2024
- 2026 TradingView Guide: Every Button & Menu Explained
💡 Register on Binance with referral code B2345 for the maximum trading fee discount. See Binance complete guide.
⚠️ Risk Disclaimer: Crypto prices are highly volatile. This is not investment advice.


